1. What is GPEdit?
GPEdit is a database to provide a comprehensive resource of the genetic and pharmacogenomic landscape of editings for 33 human cancer types in TCGA. In GPEdit, we provide following data queries: 1) Browse or search SNPs to find SNP regulated A-to-I RNA editing events in different cancer types; 2) Browse or search edQTLs associated with patient survival in different cancer types; 3) Browse or search edQTLs in GWAS LD regions and explore edQTLs associations in different diseases; 4) Browse or search drug response related RNA editing events in different cancer types.
** We recommend that you use Chrome, Edge or Safari for the best user experience. Internet Explorer are not compatible.
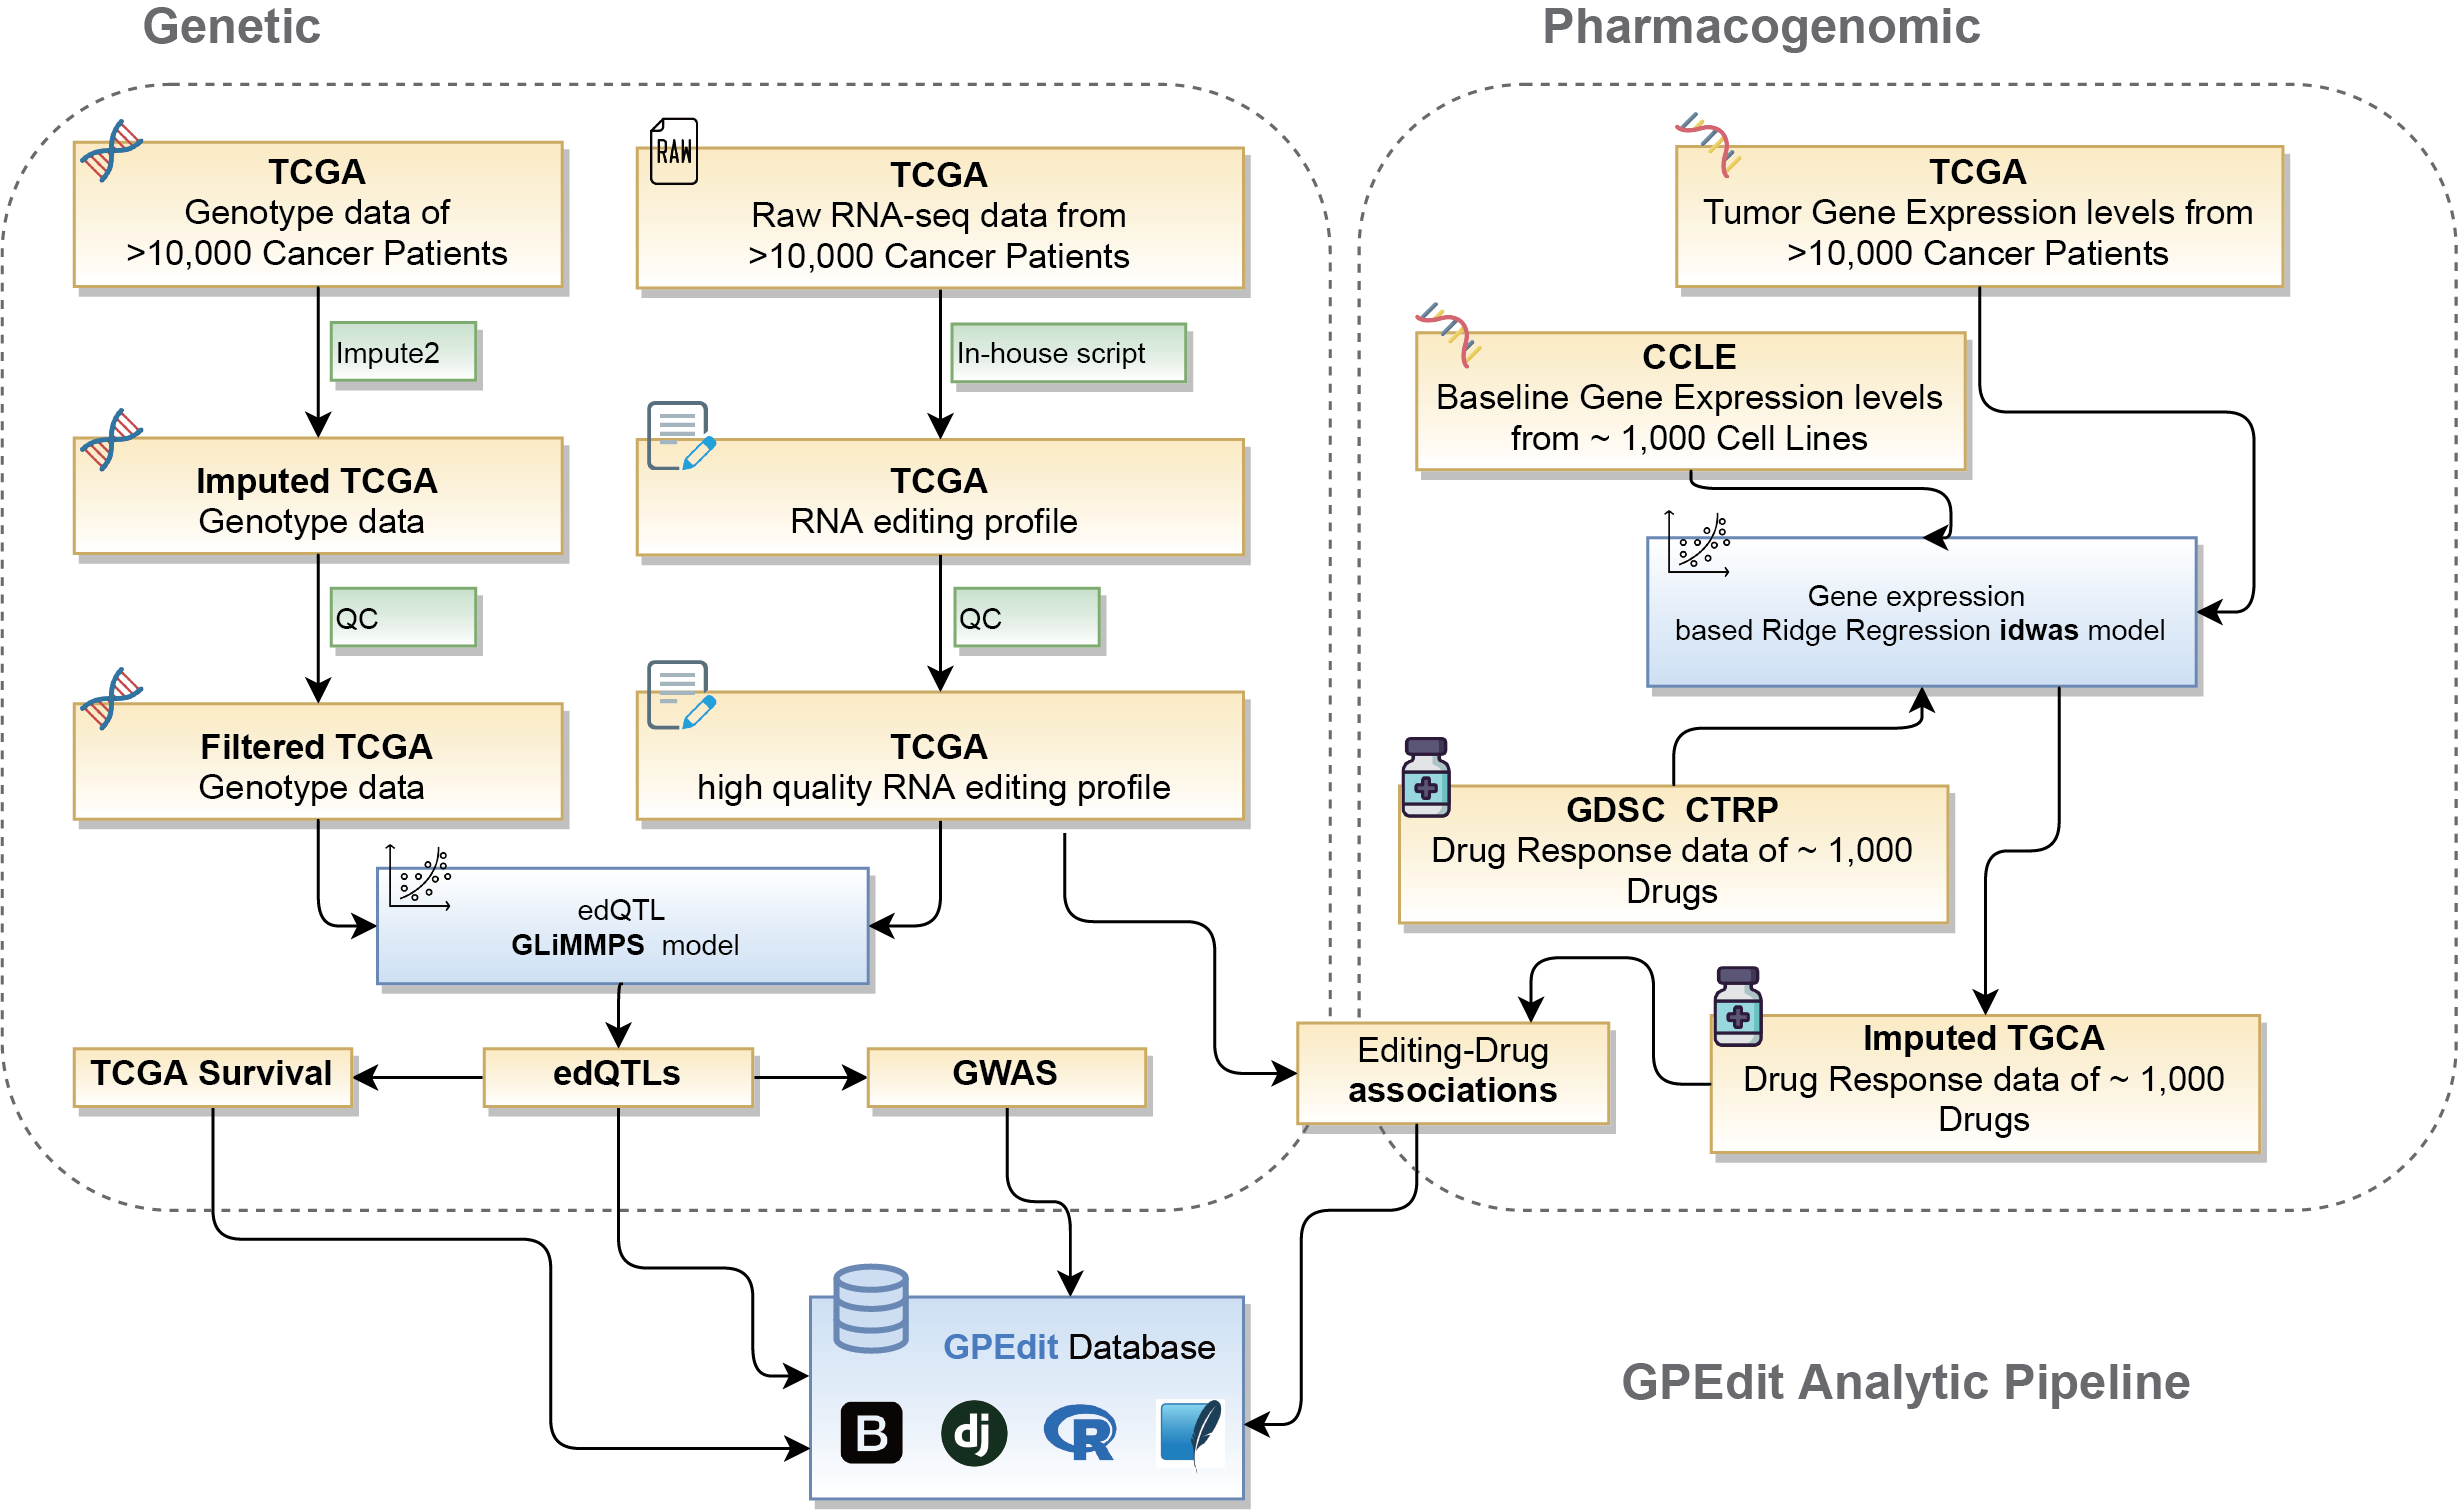
2. The analytic pipeline of GPEdit.
3. Data summary.
4. The identification of edQTLs.
TCGA raw RNA-seq data were downloaded from GDC data portal . For A-to-I RNA editing calling, we used an in-house pipeline, which was described in our previous publications (Han et al. 2015). TCGA genotype data were also obtained for GDC data portal. To increase edQTL detection power, we further used IMPUTE2 to impute autosomal variants of all samples in each cancer type with haplotypes of 1000 Genomes Phase 3 as the reference panel. GLiMMPS model (Zhao et al. 2013) were tweaked as described in (Park et al. 2017 ) used for edQTLs detection in each cancer type.
The clinical data including the survival time of patients were also downloaded from the GDC data portal. We further associate edQTLs with patient overall survival.
GWAS tag SNPs were downloaded from GWAS catalog website and the GWAS linkage disequilibrium regions were extracted from SNAP database . EdQTLs that overlapped with tag SNPs and/or linkage disequilibrium regions were extracted as GWAS-related edQTLs.
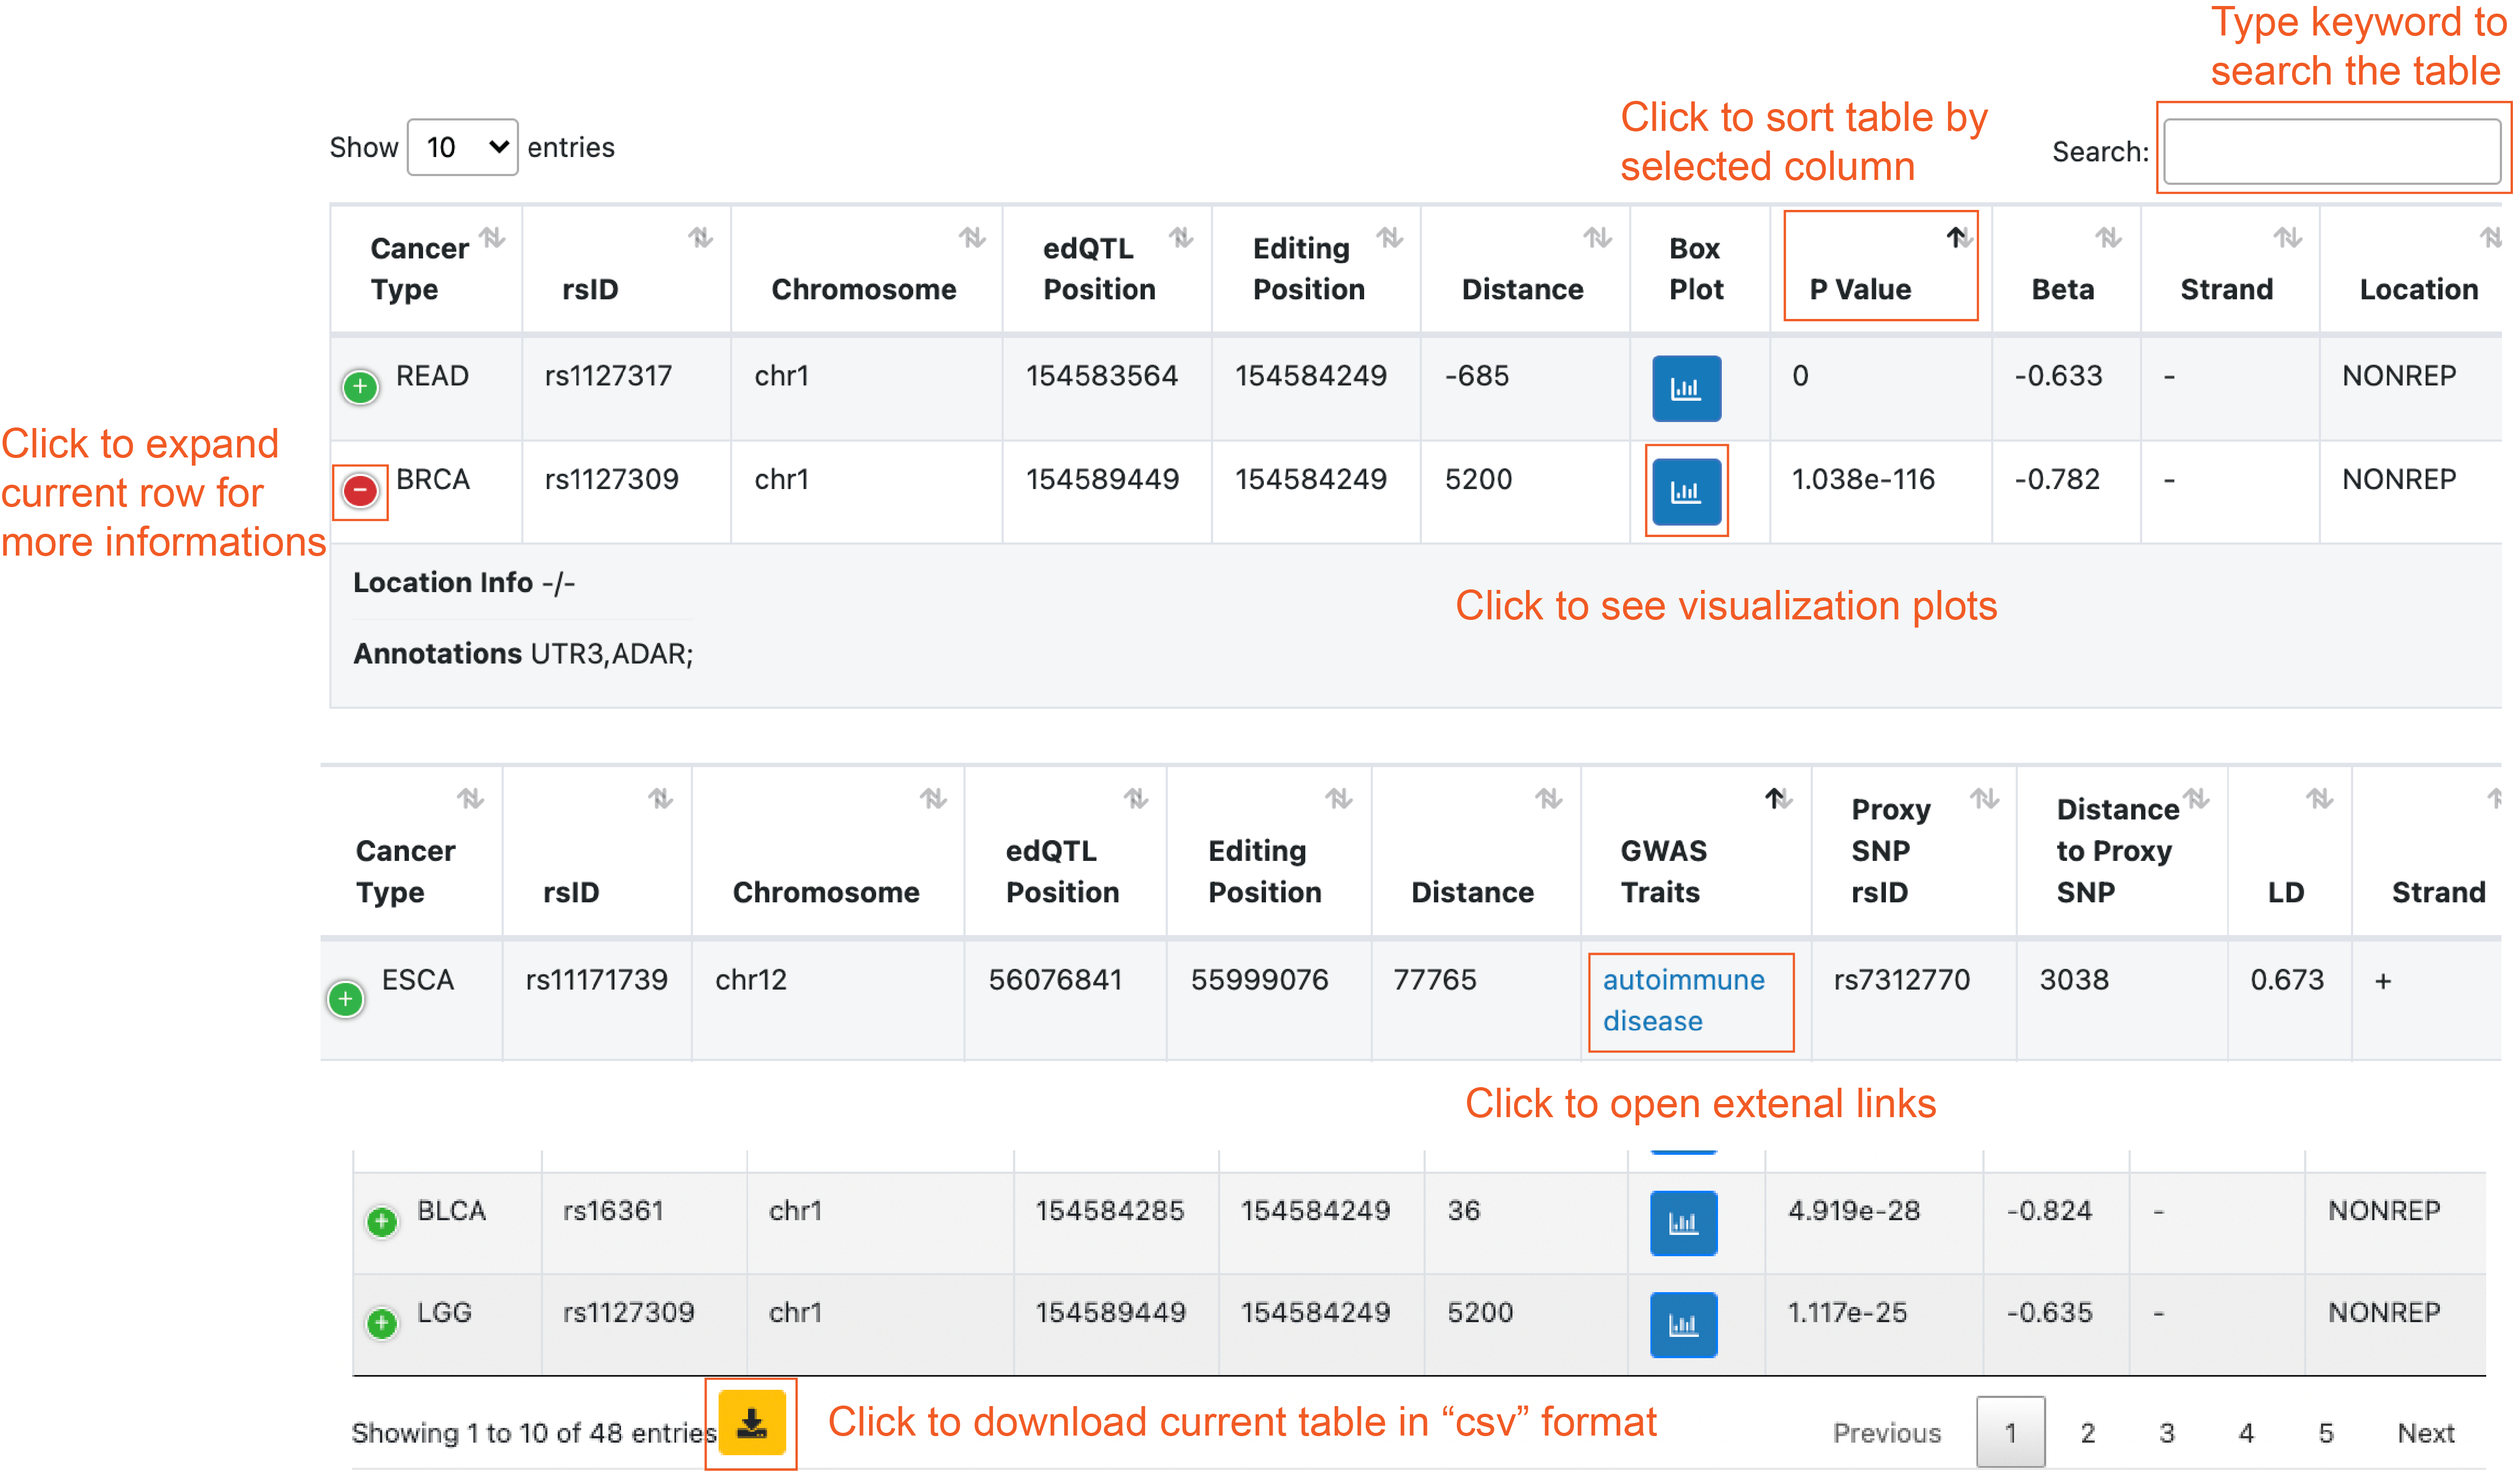
5. Notes on query return tables.
6. The edQTL boxplot and survival Kaplan-Meier plot.
edQTL boxplot
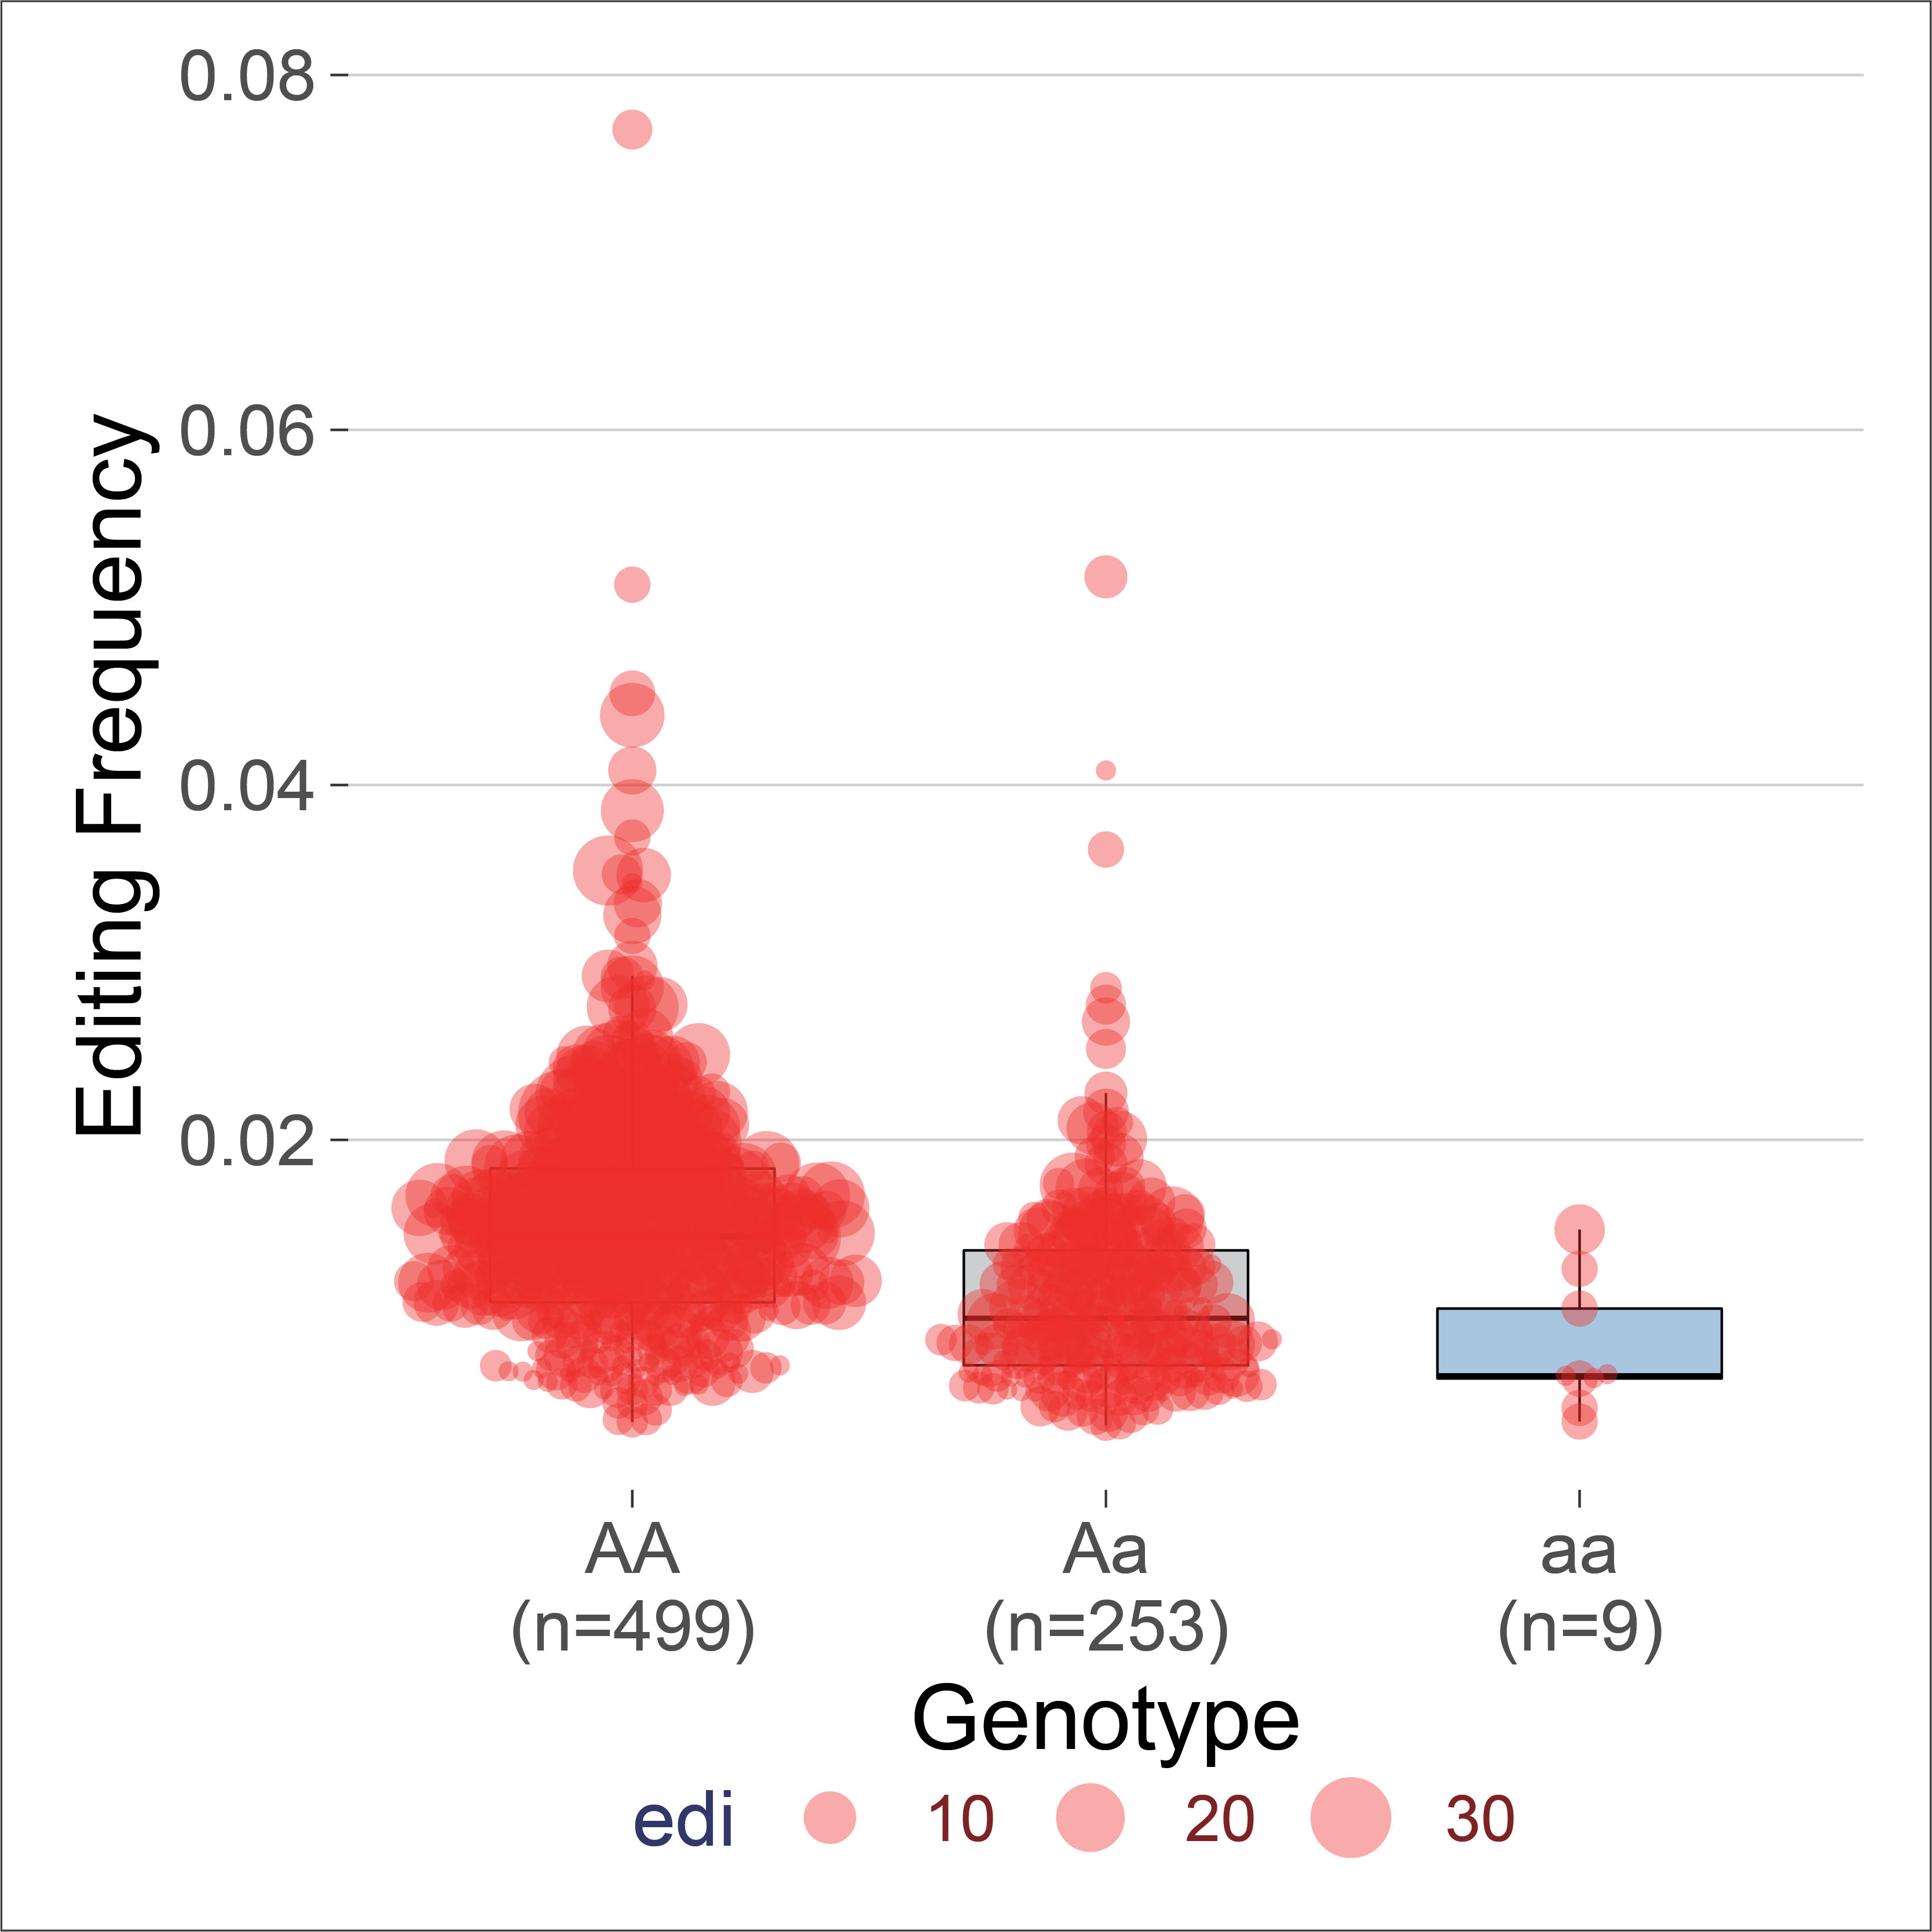
Boxplots represent the A-to-I RNA editing frequencies in individuals carrying homozygote AA, heterozygous Aa, and homozygote aa, respectively.The size of dots represent how many editing reads in each sample
Kaplan-Meier plot
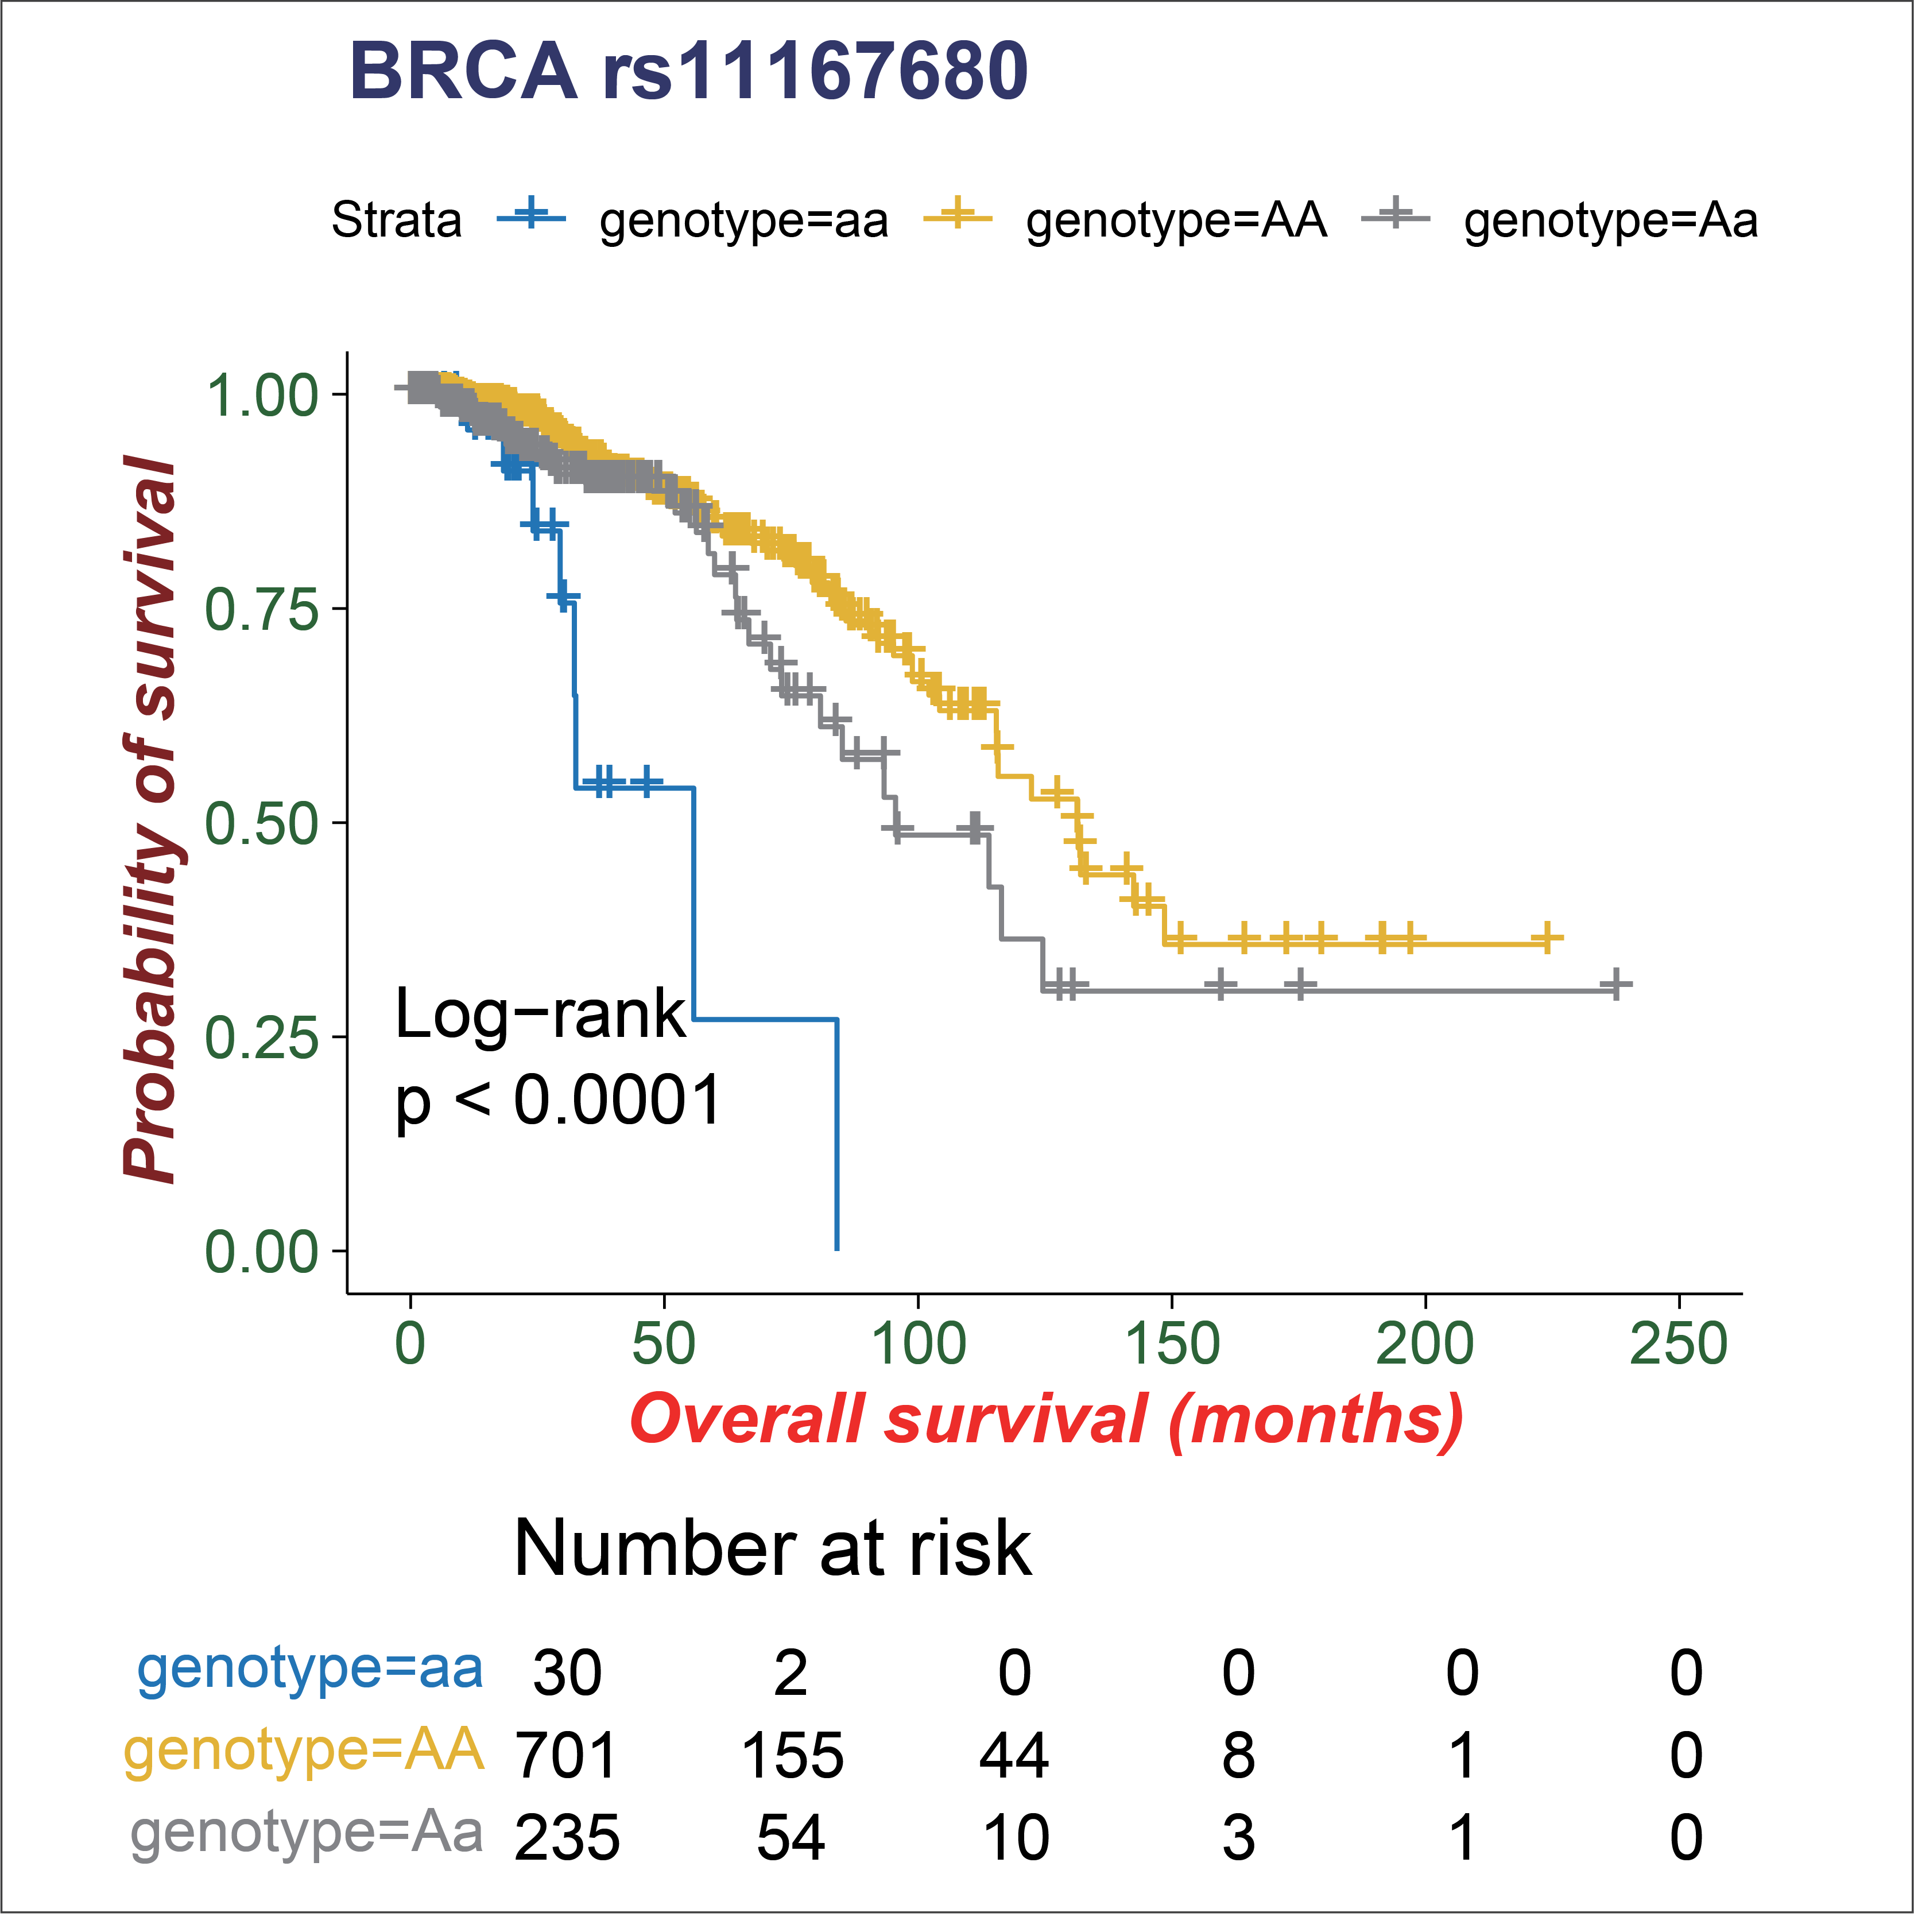
Lines represent the survival curve for individuals carrying homozygote AA, heterozygousAa, and homozygote aa, respectively.
7. Drug response-related editing.
We used established Cox regression model in idwas,( Geeleher et al. 2017) to impute drug response of TCGA patients to explore the impact of editing expression on drug response. Associations between editing frequencies and imputed drug response of cancer patients were analyzed using Pearson's correlation. Drug response-associated editing events were defined as FDRs < 0.01.