1. What is GPSno?
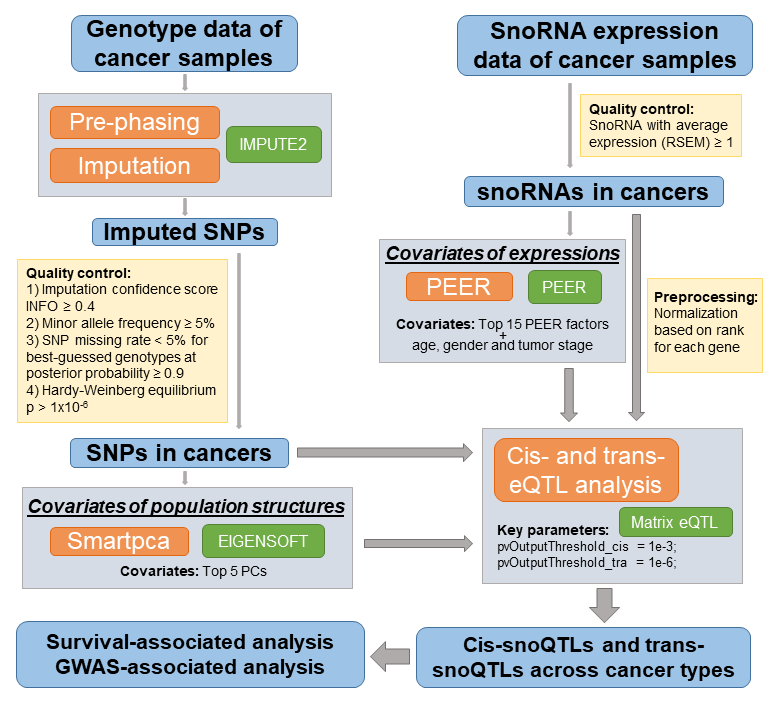
GPSno is a database to provide a comprehensive resource of the genetic and pharmacogenomic landscape of snoRNAs for 29 human cancer types in TCGA with sample size larger than 50. In GPSno, users can: 1) Browse or search SNPs to find cis- and trans- regulated snoRNAs in different cancer types; 2) Browse or search snoRNAs to find related SNPs in different cancer types; 3) Browse or search snoQTLs associated with patient survival in different cancer types; 4) Browse or search snoQTLs in GWAS LD regions and annotated these snoQTLs in different diseases; 5) Browse or search drug response-related snoRNAs in different cancer types.
** We recommend that you use Chrome, Firefox or Safari for the best experience. Internet Explorer and Microsoft Edge are not fully compatible.
2. The analytic pipeline of genetic impact on snoRNA expression.
3. The summary of data.
| pairs |
esnoRNAs |
snoQTLs |
pairs |
esnoRNAs |
snoQTLs |
pairs |
unique tag_SNP |
unique snoQTL |
sample size |
snoRNA-drug pairs |
| ACC |
78 |
465 |
3 652 701 |
244 |
9 |
244 |
0 |
0 |
0 |
78 |
26 |
4 |
26 |
77 |
34 |
| BLCA |
397 |
411 |
4 221 213 |
2697 |
69 |
2681 |
1383 |
54 |
1045 |
141 |
1272 |
38 |
853 |
127 |
92 |
| BRCA |
1073 |
464 |
2 791 786 |
3752 |
146 |
3643 |
2192 |
105 |
1455 |
3 |
1562 |
62 |
982 |
942 |
5 |
| CESC |
290 |
400 |
4 417 705 |
2225 |
66 |
2224 |
1659 |
67 |
1300 |
149 |
1154 |
35 |
716 |
173 |
101 |
| COAD |
433 |
456 |
4 191 023 |
3246 |
89 |
3231 |
1111 |
39 |
821 |
0 |
1229 |
41 |
877 |
4 |
- |
| ESCA |
184 |
401 |
4 541 112 |
1680 |
30 |
1679 |
1026 |
31 |
769 |
0 |
911 |
21 |
601 |
172 |
0 |
| HNSC |
521 |
415 |
4 311 502 |
4050 |
82 |
3906 |
1771 |
39 |
1237 |
0 |
1695 |
43 |
1061 |
0 |
- |
| KICH |
66 |
391 |
3 871 603 |
417 |
10 |
417 |
0 |
0 |
0 |
0 |
69 |
3 |
69 |
0 |
- |
| KIRC |
512 |
441 |
4 600 464 |
4465 |
86 |
4197 |
1779 |
51 |
1180 |
110 |
1640 |
54 |
1019 |
0 |
- |
| KIRP |
289 |
424 |
4 948 299 |
2867 |
59 |
2851 |
1201 |
38 |
813 |
27 |
1037 |
27 |
647 |
51 |
114 |
| LGG |
511 |
423 |
4 662 087 |
3333 |
62 |
3322 |
1251 |
42 |
885 |
28 |
1392 |
42 |
973 |
70 |
324 |
| LIHC |
370 |
451 |
4 192 863 |
2059 |
85 |
1990 |
1066 |
41 |
738 |
21 |
1005 |
28 |
621 |
183 |
97 |
| LUAD |
512 |
453 |
4 416 162 |
4308 |
77 |
4035 |
1679 |
52 |
1106 |
422 |
1486 |
47 |
998 |
0 |
- |
| LUSC |
475 |
446 |
3 811 695 |
3221 |
78 |
3194 |
1598 |
52 |
1243 |
0 |
1348/td>
| 39 |
927 |
0 |
- |
| MESO |
87 |
414 |
4 861 983 |
927 |
15 |
927 |
441 |
10 |
336 |
0 |
435 |
6 |
233 |
0 |
- |
| OV |
462 |
486 |
2 307 154 |
2299 |
159 |
2184 |
1509 |
88 |
887 |
45 |
1153 |
42 |
583 |
0 |
- |
| PAAD |
178 |
398 |
5 061 023 |
2017 |
39 |
2017 |
884 |
25 |
562 |
3 |
1082 |
24 |
732 |
117 |
35 |
| PCPG |
178 |
401 |
4 804 919 |
1468 |
36 |
1462 |
377 |
17 |
328 |
30 |
343 |
16 |
287 |
176 |
791 |
| PRAD |
480 |
417 |
4 859 157 |
4114 |
64 |
4096 |
2199 |
63 |
1501 |
156 |
1818 |
47 |
1048 |
150 |
1419 |
| READ |
160 |
472 |
4 638 399 |
1540 |
34 |
1539 |
1033 |
39 |
750 |
215 |
793 |
20 |
477 |
0 |
- |
| SARC |
245 |
388 |
4 263 388 |
1641 |
48 |
1638 |
830 |
34 |
571 |
309 |
829 |
21 |
529 |
229 |
264 |
| SKCM |
97 |
451 |
4 768 644 |
987 |
20 |
987 |
958 |
23 |
673 |
20 |
631 |
13 |
331 |
57 |
38 |
| STAD |
409 |
434 |
4 406 785 |
2420 |
50 |
2376 |
1281 |
48 |
922 |
0 |
1148 |
32 |
750 |
0 |
- |
| TGCT |
150 |
472 |
4 893 554 |
1922 |
31 |
1922 |
1205 |
28 |
846 |
1 |
1024 |
25 |
638 |
148 |
7226 |
| THCA |
496 |
435 |
4 889 302 |
5322 |
92 |
5067 |
2247 |
60 |
1525 |
8 |
1948 |
50 |
1156 |
387 |
286 |
| THYM |
124 |
462 |
5 132 519 |
1675 |
30 |
1675 |
750 |
21 |
452 |
1 |
857 |
15 |
544 |
119 |
5043 |
| UCEC |
536 |
480 |
4 101 587 |
2826 |
81 |
2820 |
2079 |
71 |
1459 |
79 |
1410 |
46 |
837 |
7 |
- |
| UCS |
56 |
450 |
4 008 108 |
227 |
8 |
227 |
0 |
0 |
0 |
0 |
1 |
1 |
1 |
57 |
1 |
| UVM |
80 |
420 |
4 778 965 |
1167 |
22 |
1167 |
871 |
20 |
634 |
0 |
497 |
12 |
240 |
77 |
523 |
4. The snoQTL boxplot and survival Kaplan-Meier plot.
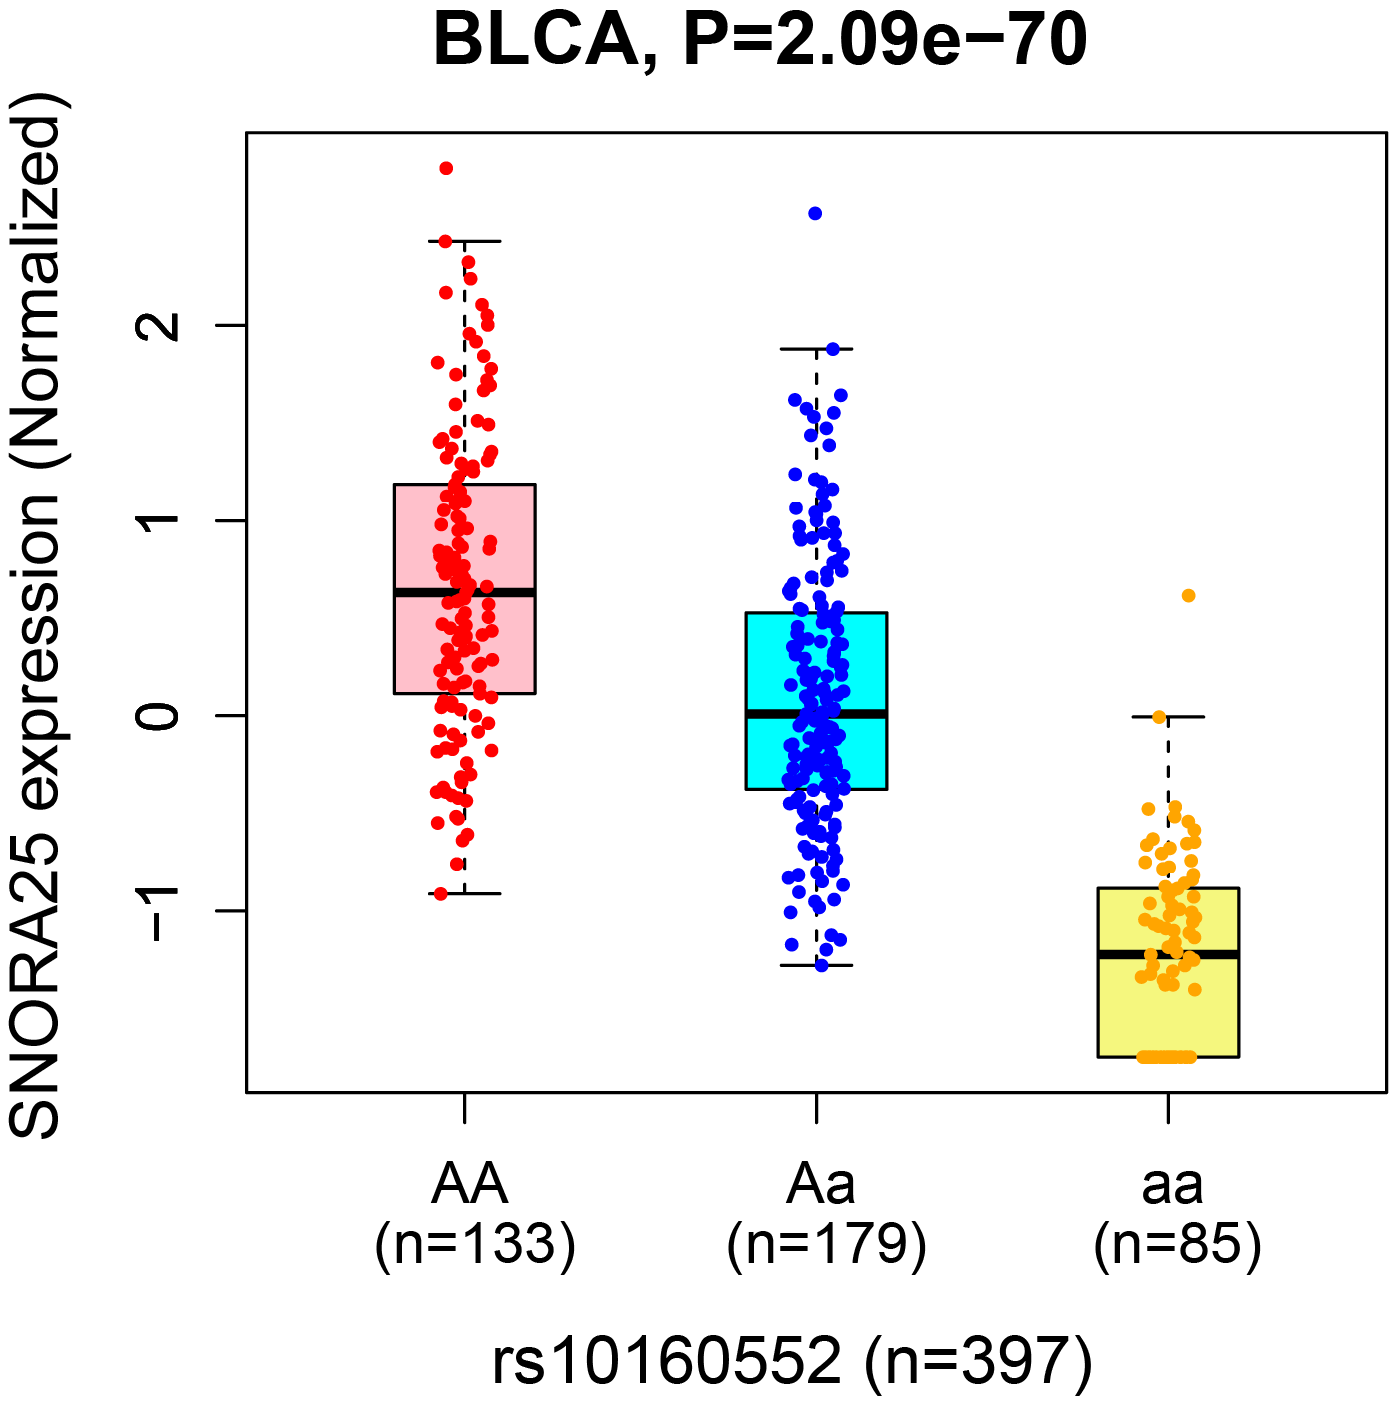
Boxplots represent the gene expression in individuals carrying homozygote AA, heterozygous Aa, and homozygote aa, respectively. |
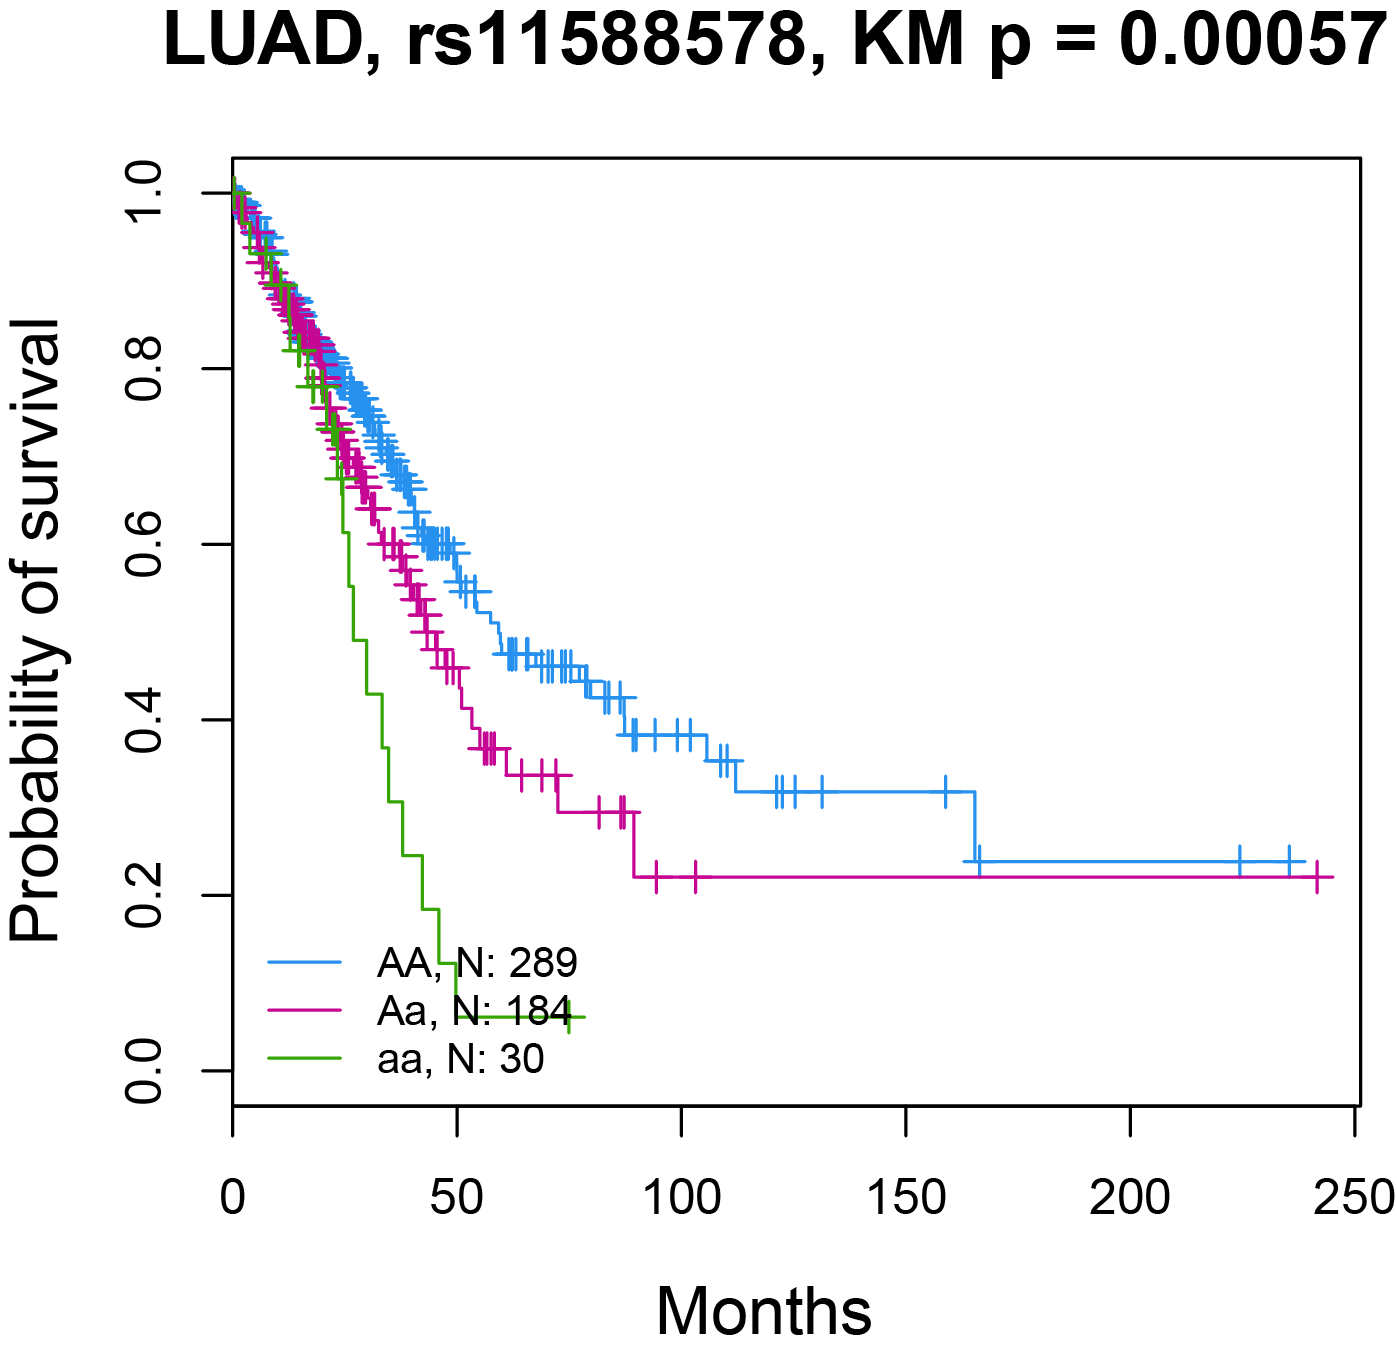
Lines represent the survival curve for individuals carrying homozygote AA, heterozygousAa, and homozygote aa, respectively. |
5. The identification of GWAS-related snoQTLs.
GWAS tagSNPs were downloaded from GWAS catalog website (http://www.ebi.ac.uk/gwas/) and the GWAS linkage disequilibrium regions were extracted from SNAP database (https://personal.broadinstitute.org/plin/snap/ldsearch.php). snoQTLs that overlapp with tagSNPs and/or linkage disequilibrium regions were extracted as GWAS-related snoQTLs.
6. Drug response-related snoRNA.
We acquired imputed drug response data of TCGA patients to explore the impact of snoRNA expression on drug response. Associations between standardized snoRNA expression and imputed drug response of cancer patients were analyzed using Pearson's correlation. Drug response-associated snoRNAs were defined as FDRs <0.05.