Help
Query APA landscape
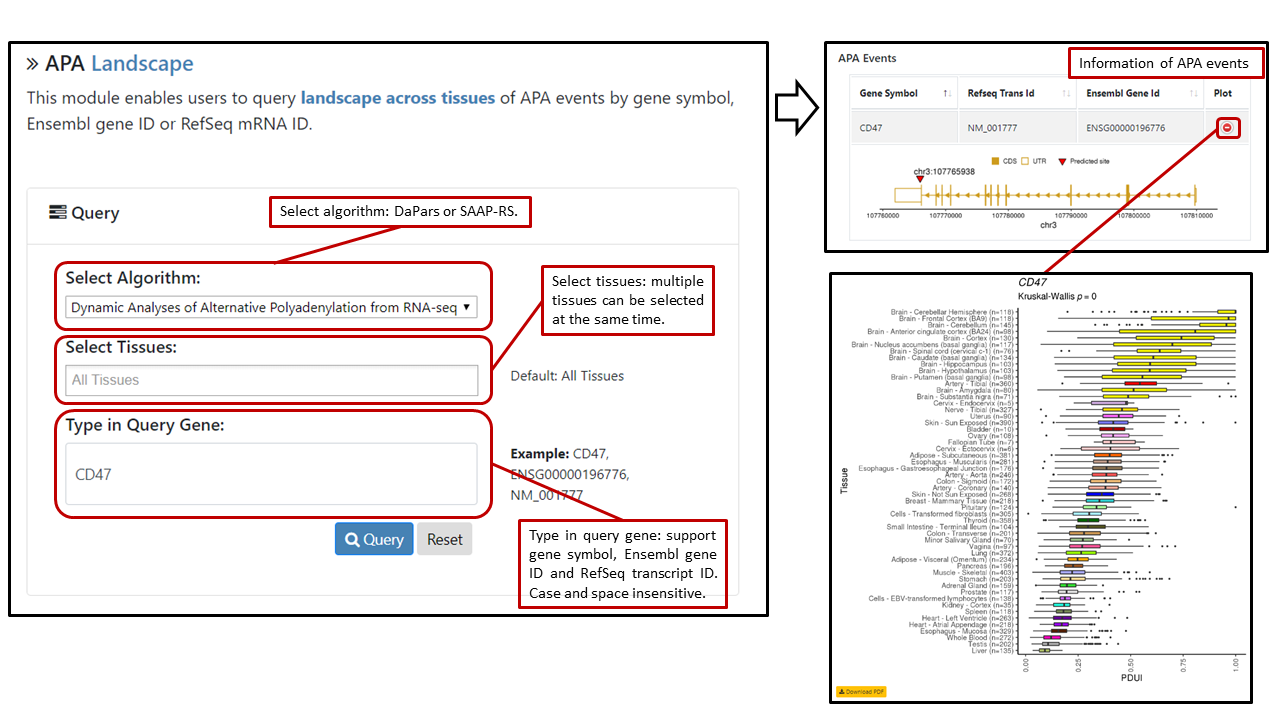
Users can select algorithm [Dynamic Analyses of Alternative Polyadenylation from RNA-seq (DaPars) or Significance Analysis of Alternative Polyadenylation using RNA-seq (SAAP-RS)] and multiple tissues (default: all tissues), query APA events by typing gene symbol, RefSeq transcript ID or Ensembl gene ID in the search box. The search box is case- and space-insensitive. A table with algorithm, gene symbol, RefSeq transcript ID, Ensembl gene ID of queried APA events will be shown. Users can click on the "plot" button to view the gene structure, position of APA site and landscape boxplot. Sample sizes in the plot denote numbers of samples that have APA events, which could be different from original sample sizes.
Query APA trait relevance
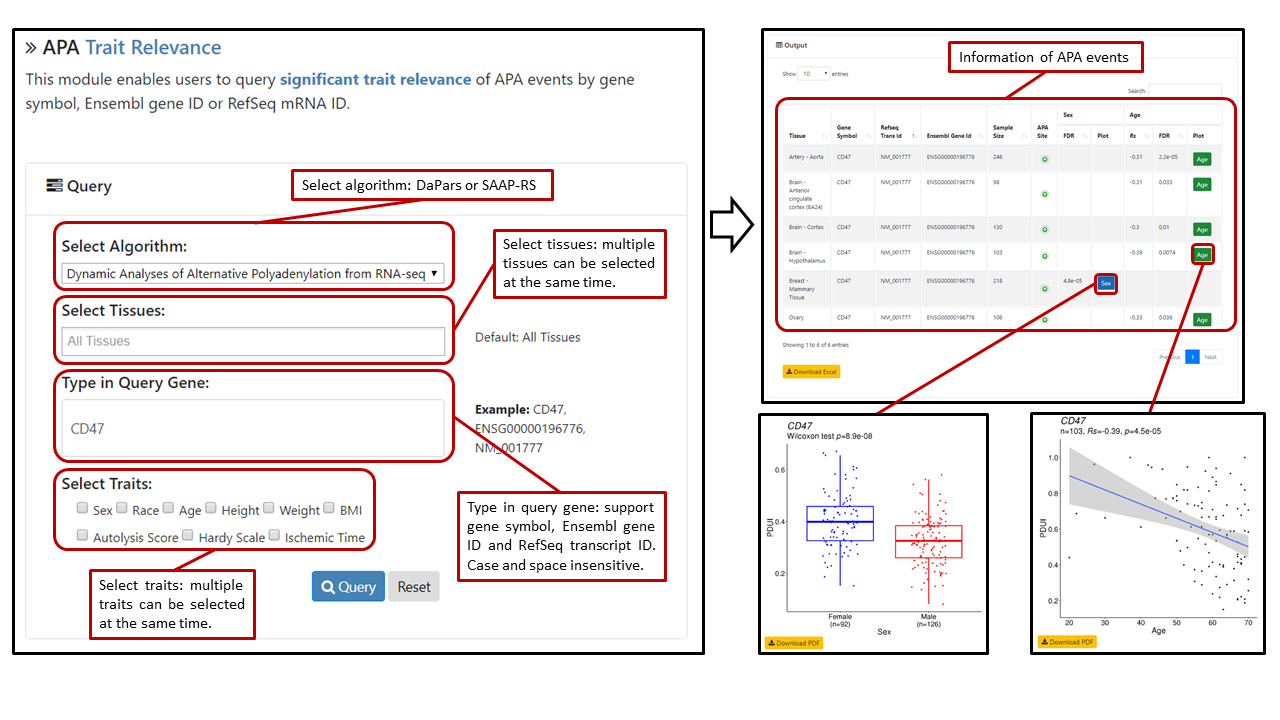
Users can select algorithm (DaPars or SAAP-RS), multiple tissues (default: all tissues) and traits; query APA events by typing gene symbol, RefSeq transcript ID or Ensembl gene ID in the search box. The search box is case- and space-insensitive. Details of APA events with algorithm, tissue, gene symbol, RefSeq transcript ID, Ensembl gene ID P-value, sample size and significance (Rs and FDR for continues traits like age, height, weight and BMI; FDR for categorical traits like sex, race, autolysis score, hardy scale and ischemic time) will be displayed in the table. Only significant results are shown. Users can click on the "plot" button to view the relevance diagram. Sample sizes in the plot denote numbers of samples that have APA events, which could be different from original sample sizes. Users can also view the gene structure and APA site by clicking the “APA Site” button.
Query APA expression correlation
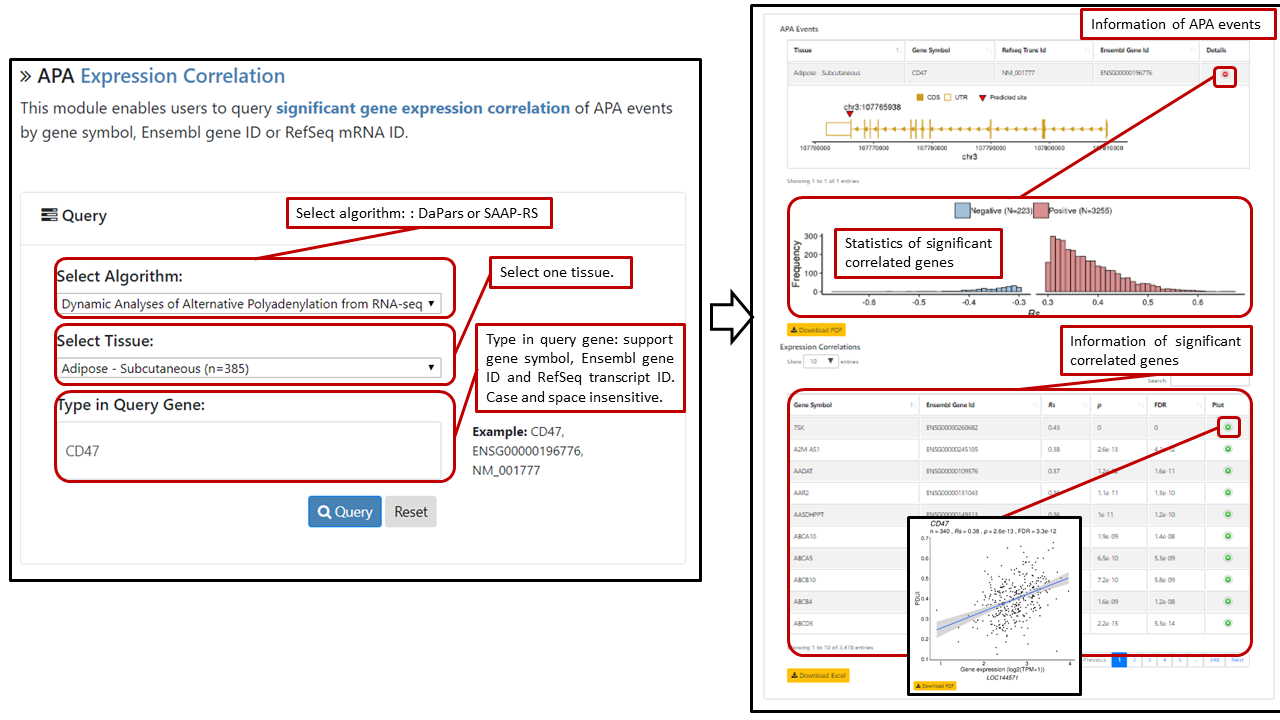
Users can select algorithm (DaPars or SAAP-RS) and tissue, query APA events by typing gene symbol, RefSeq transcript ID or Ensembl gene ID in the search box. The search box is case- and space-insensitive. A table with algorithm, gene symbol, RefSeq transcript ID, Ensembl gene ID of the APA events will be returned. For each APA event, a table contains gene symbol, ensemble gene ID, Rs, p, FDR of each significantly expression-correlated genes as well as gene structure plot can be retrieved by clicking the “Details” button. If number of significant correlations ≥ 10, a histogram of the distribution of positively and negatively correlated genes is provided. Users can further retrieve the Spearman correlation plot for each expression correlation gene by clicking the "plot" button. Sample sizes in the plot denote numbers of samples that have APA events, which could be different from original sample sizes.
Methods
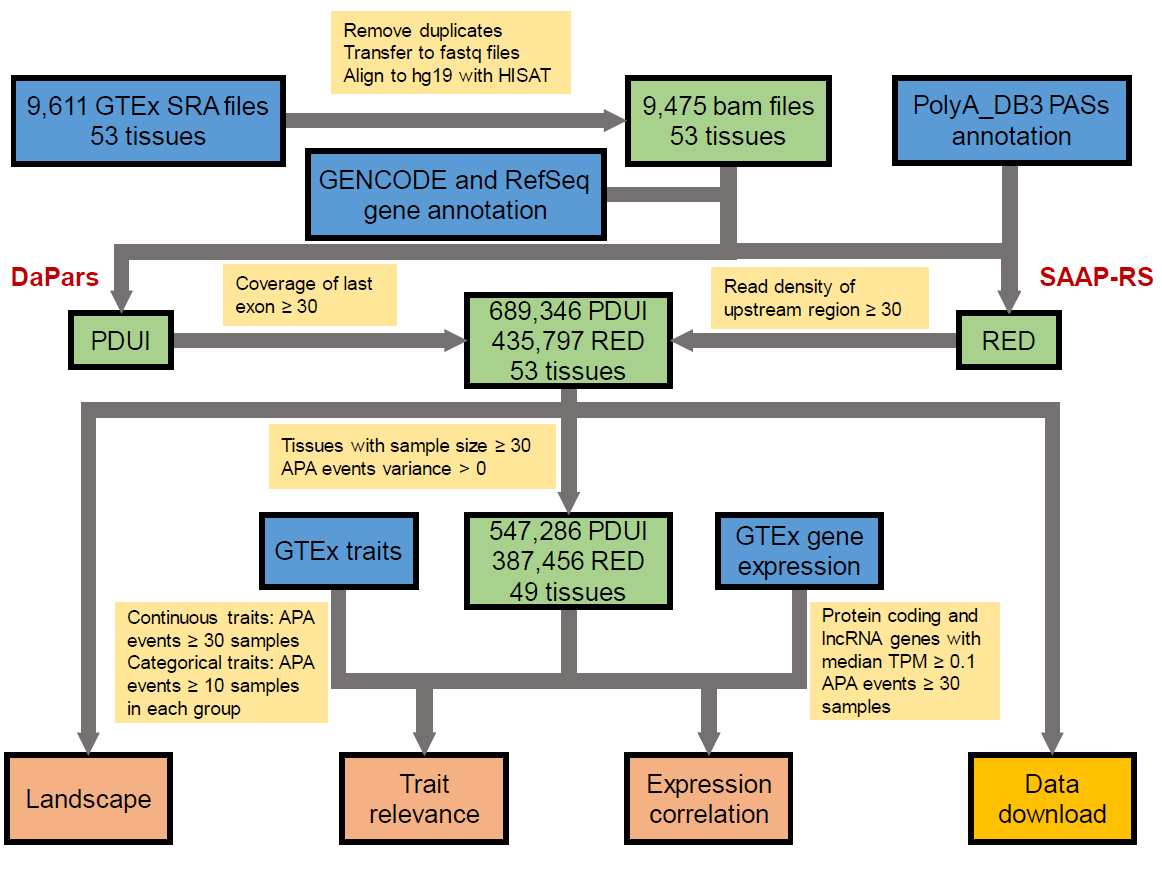
Database construction pipeline
Quantification of APA
Annotation of last exon was collected from GENCODE v19 and NCBI RefSeq hg19. Two different algorithms were used to calculated APA events for each gene in each tissue. Percentage of Distal polyA site Usage Index (PDUI) was calculated by DaPars, which performs de novo identification and quantification of dynamic APA events, uses a regression model to infer the location of the proximal APA site. PDUI was defined as the proportion of transcripts with distal polyA sites. We required that the average normalized reads for each 3'UTR region be ≥ 30. Relative Expression Difference (RED) was calculated was calculated following the SAAP-RS pipeline. polyadenylation site (PAS) annotation was collected from PolyA_DB3. First conserved PAS located at the 3’-most exon were chosen as reference PAS. RED was standardized across all the 9,475 samples. We required the read density of the last exon be ≥ 30.
APA landscape across tissues
In total, we identified 689,346 APA events (median: 13,063 per tissue) with DaPars, and 435,797 APA events (median: 8,322 per tissue) with SAAP-RS, respectively. In order to ensure the statistical power, we filtered APA events with zero variance and performed further analysis for tissues with sample size ≥ 30. For each gene, Wilcoxon test (two tissues) or Kruskal-Wallis test (three or more tissues) were used to test the significance of APA usage difference among tissues.
Association between APA and traits
For continuous traits (age, height, weight and BMI), Spearman's rank correlation were used to calculate the correlation coefficient (Rs). We required APA events ≥ 30 samples in a tissue. We defined significant correlation as absolute value of Rs > 0.3 and False Discovery Rate (FDR) < 0.05. For categorical traits (sex, race, autolysis score, hardy scale and ischemic time), Wilcoxon test (two groups) or Kruskal-Wallis test (three or more groups) were used to test the significance of APA usage difference between trait groups. were used to test the significant difference of APA usage among trait groups with ≥ 10 samples. Significant difference across different groups in categorical traits was defined as FDR < 0.05.
Correlation between APA and gene expression
Expression matrix was download from GTExPortal (release V7). Protein coding genes and lncRNA genes with median transcripts per million (TPM) ≥ 0.1 in a tissue were remained. We required APA events ≥ 30 samples in a tissue. We used Spearman's rank correlation to calculate the correlation coefficient (Rs) between APA and gene expression, and performed multiple correction by FDR. We defined significant correlation between gene expression level and APA usage with absolute value of Rs > 0.3 and FDR < 0.05.
How to cite
Please cite:
APAatlas: decoding alternative polyadenylation across human tissues
Hong, W., Ruan,H., Zhang, Z., Ye, Y., Liu, Y., et al.
Nucleic Acids Research, 05 Oct. 2019, Volume 48, Issue D1, D34–D39, doi:10.1093/nar/gkz876