Analysis description
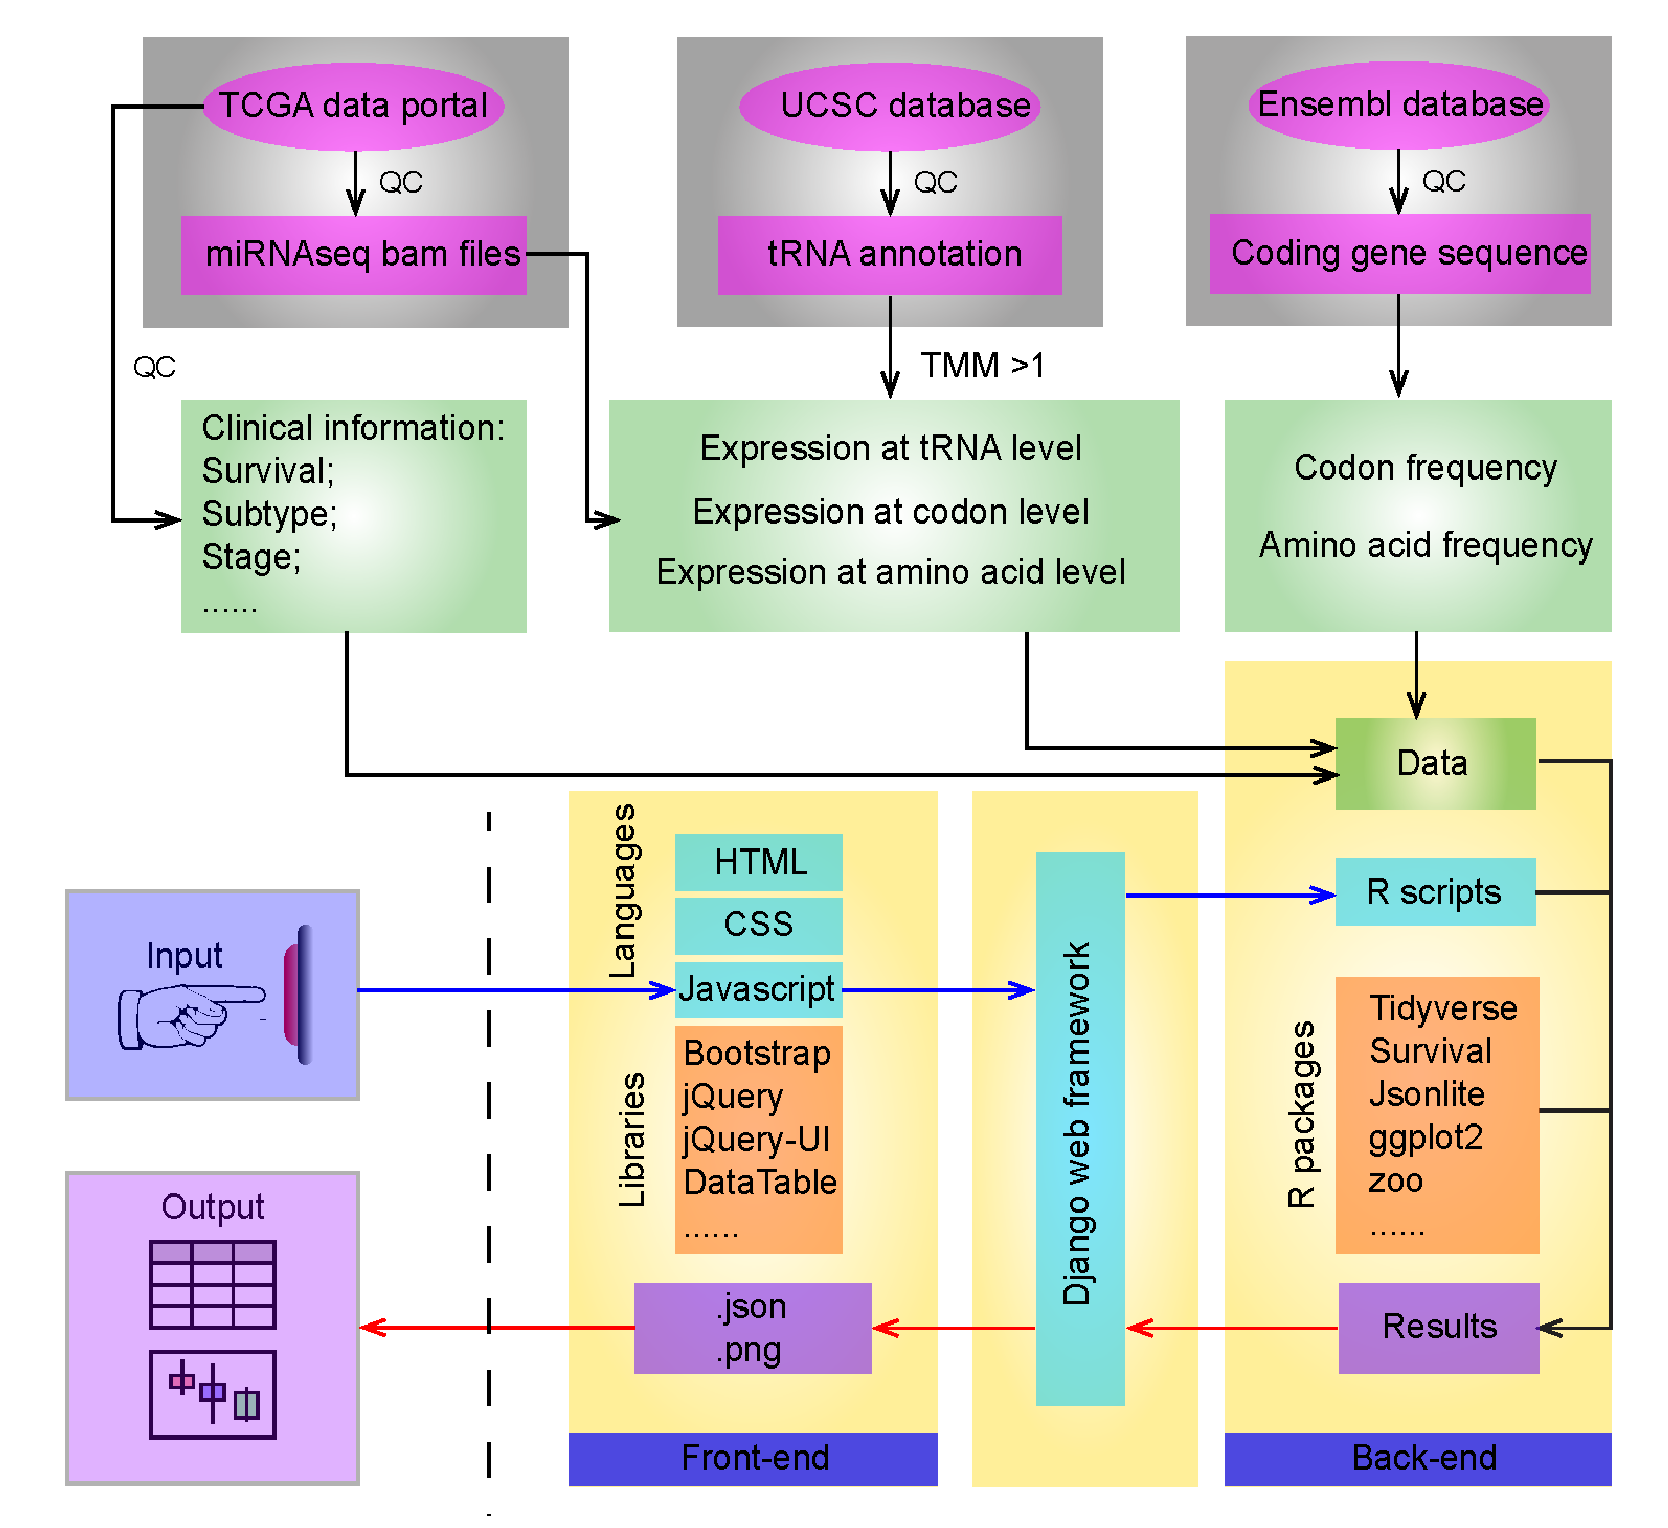
tRNAs Quantification
tRNA annotation downloaded from UCSC Genome Browser (hg19), and miRNAseq data of 16,591 samples downloaded from TCGA’s data. The duplicated samples and lower-quality samples with fewer than 50% that passed quality control or fewer than 80% of reads that mapped to the human genome were filtered out. We obtained 9,931 patient tumor samples across 31 cancer types and their related 663 non-tumor tissue samples for use in the analyses. We then mapped reads to tRNA genes and quantified them using the trimmed mean of M values (TMM) method. tRNAs with an average TMM ≥ 1 across samples in each cancer type were defined as detectable tRNAs, followed by log2 transformation. We then merged tRNA expression at the codon and amino acid levels based on Watson-Crick match. tRNA profiles were deposited in Synapse (syn8367000).
Clinical analysis
Clinical information were obtained from the TCGA data portal. We identify expression alteration of tRNA between paired tumor and normal samples, among established tumor subtypes or tumor stages, including tumor subtypes, disease stage, and patient survival. Groups with fewer than five samples were excluded from the analysis. For cancer types with survival time available, we performed the univariate Cox test to examine whether the tRNA was significantly correlated with patient 5-year survival. For each significant tRNA, tRNAs were dichotomized at the median expression level, and the Kaplan-Meier curves was plotted to represent the average survival time of each groups and log-rank test was used to examine the difference of the survival time of each groups.
Examples
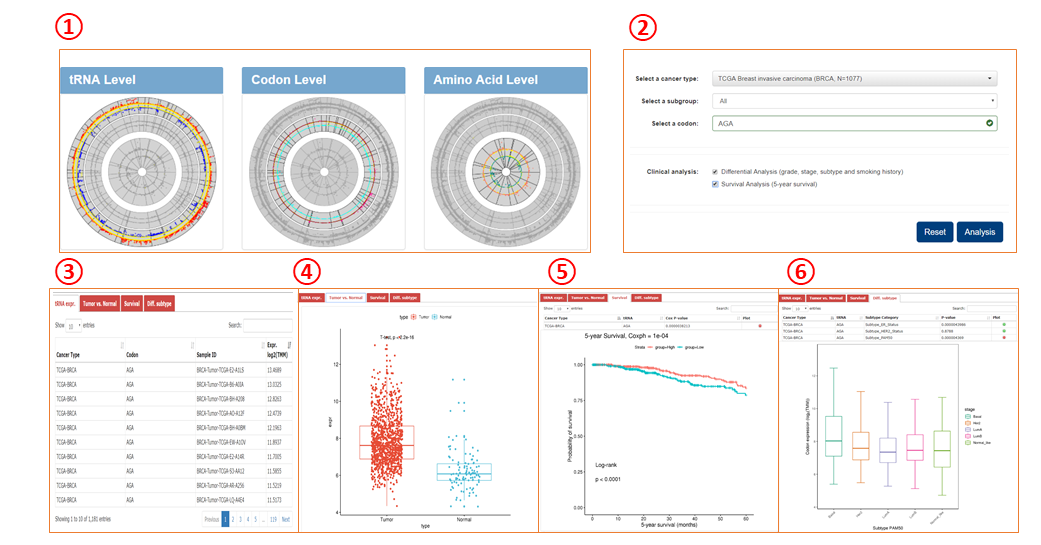
Module 1-3
1. Query modules for tRNA, codon, and amino acid are similar.
2. Query box for one module.
3. Query returns of tRNA expression in patient samples.
4. Query returns of differential expression between tumor and normal samples.
5. Query returns of overall survival analyses.
6. Query returns of differential expression across different subgroups.
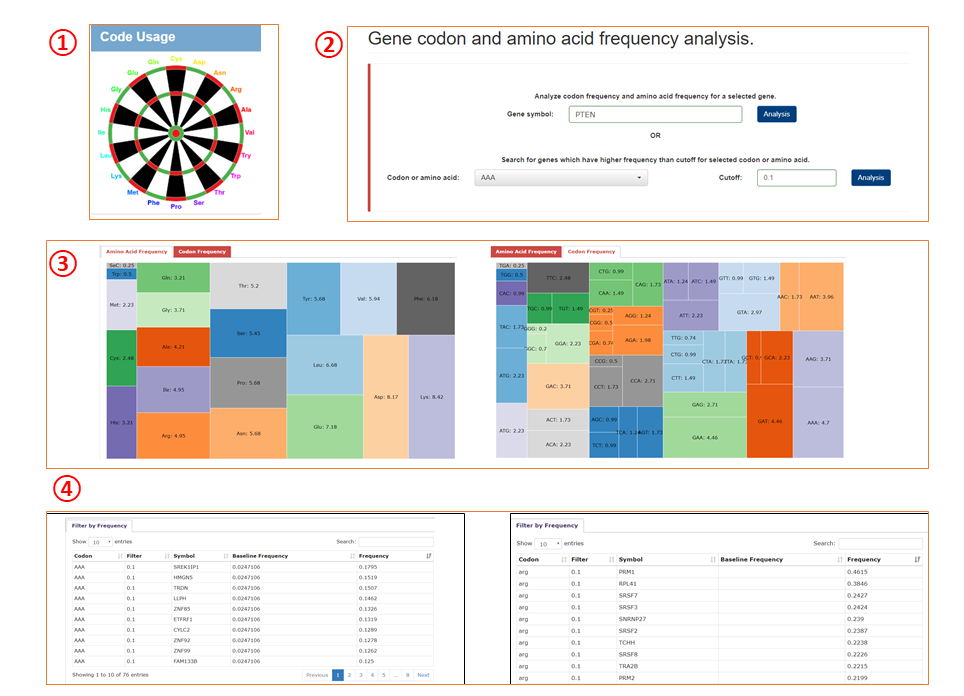
Module 4
1. Query module for codon usage.
2. Query box for the module.
3. Query returns of gene based analyses. Number in each cell denotes the usage (%) of codon/amino acid in the query gene.
4. Query returns of codon/amino acid based analyses.