Help
How to query


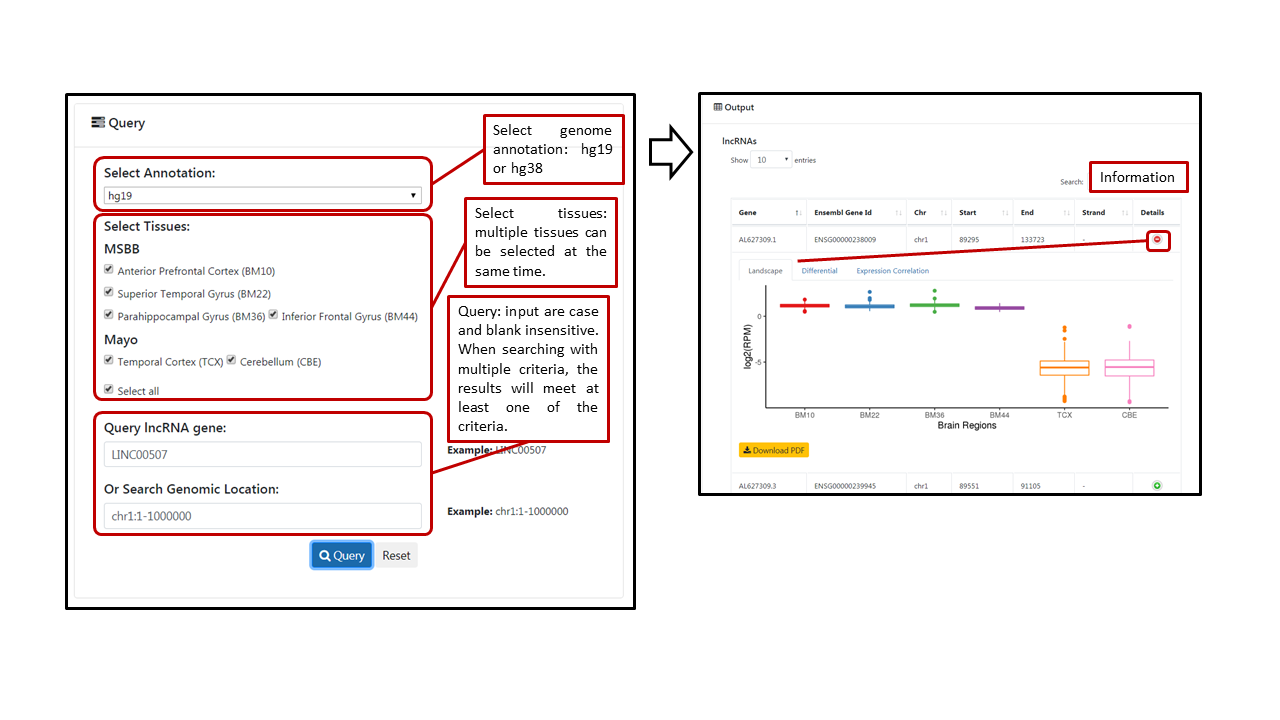
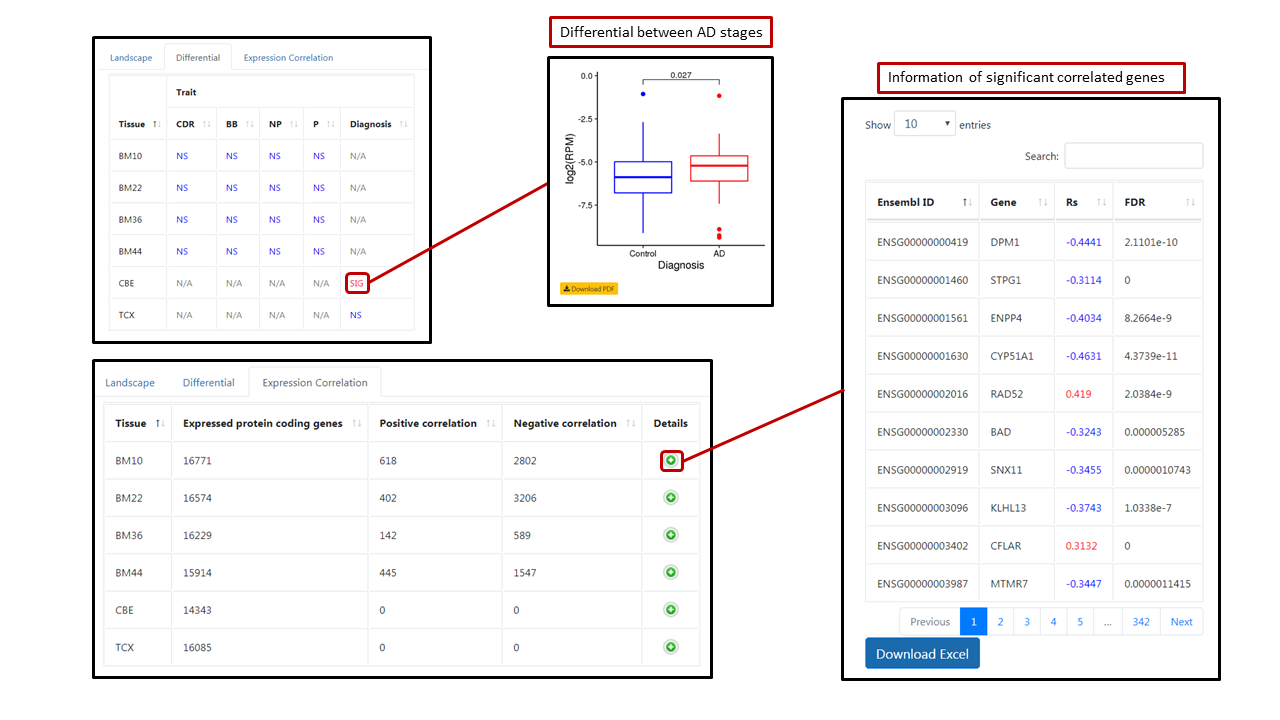
In each module, users can select genome annotation (hg19 or hg38) and multiple tissues (default: all tissues). For querying noncoding RNA or post-transcriptional regulation event, we provide multiple searching criteria. Users can directly typing gene symbol (lncRNA and APA), Ensembl gene ID (lncRNA and APA), enhancer ID (eRNA) or editing site position (A-to-I editing) in the first search box to query individual noncoding RNA or post-transcriptional regulation event. User can also search genomic region or related gene (A-to-I editing module only). All the search boxes are case- and space-insensitive. If input mutiple searching conditions, the result will meet at least one of the conditions. A table with tissue and corresponding transcription features will be shown after clicking "Query". Users can click on the "Details" button to view the landscape, differential and protein coding gene expression (not in A-to-I editing module). In the "Differential" tab, the table shows tissue and differential between AD stages defined by each trait. Users can click the "SIG" to view and download the box plot of significantly differential between AD stages. In the "Correlation" tab, the table shows tissue and number of significantly correlated protein-coding genes. Users can click the "Details" button to view and download a detailed table of correlated protein-coding genes.
Methods
Quantification
LncRNA expression
We qualified the gene expression followed the StringTie-Ballgown pipeline. Gene annotation was downloaded from GENCODE v19 and Ensembl v77. Downloaded bam files were used as input by assembler StringTie. For sample with two or more bam files, the largest one was retained. RPMs were obtained by DESeq2. In order to make the result more reliable, we required genes with enough expression in each tissue, namely, the genes with RPM values larger than 1 in more than 10 samples.
Enhancer RNA expression
The annotation from ENCODE and Roadmap considered H3K4me1 and H3K27ac marks, and annotation from FANTOM considered CAGE marks. We combined all three datasets and used those enhancers annotated in at least two datasets. We used the ± 3 kb of the middle loci of enhancer to define eRNA region. We also filtered out those eRNA regions that overlapped with known coding regions and lncRNAs (with 1 kb extension from both transcription start site and transcription end site). In particular, the ~ 500 bp (uaRNA) region was also excluded from our analysis. We also excluded all blacklist regions, including rRNA repeats. RPMs of eRNA were obtained by featureCounts and DESeq2. We removed low expression eRNAs and only retained eRNAs with mean RPM values larger than 1 in each tissue.
APA usage
Annotation of last exon was collected from GENCODE v19. For each gene, only the longest protein-coding transcript was remained. Two different algorithms were used to calculated APA events for each gene in each tissue.Percentage of Distal polyA site Usage Index (PDUI) was calculated by DaPars, which performs de novo identification and quantification of dynamic APA events, uses a regression model to infer the location of the proximal APA site. PDUI was defined as the proportion of transcripts with distal polyA sites. We required that the average normalized reads for each 3'UTR region be ≥ 30. Relative Expression Difference (RED) was calculated was calculated following the SAAP-RS pipeline. polyadenylation site (PAS) annotation was collected from PolyA_DB3. First conserved PAS located at the 3’-most exon were chosen as reference PAS. RED was standardized across all the samples within each dataset, separately. We required the read density of the last exon be ≥ 30.
A-to-I editing level
We downloaded the A-to-I RNA editing sites from REDIportal. We re-annotated A-to-I RNA editing sites based on GENCODE v19 by ANNOVAR and then filtered mutation sites annotated in dbSNP v152 and whole-exome sequencing data of MSBB and Mayo. For a specific site in a given sample, the editing level was calculated as the number of edited reads divided by the total number of reads, and only the nucleotides with base quality 20 were used. To ensure adequate statistical power, we only kept editing sites with at least three edited reads in at least 3 samples, and no less than 30 samples with coverage 10 in a brain region.
Differental across AD stages
Four cognitive or neuropathological traits are available in MSBB dataset: Clinical Dementia Rating (CDR), Braak stage, neuropathology category as measured by CERAD (NP), and mean neocortical plaque density. For each trait, we separated samples into three groups: Control, Mild, and Severe. We followed previous practices to subdivide samples regarding CDR (0-0.5, 1–2, 3–5), Braak stage (0–2, 3–4, 5–6), NP (normal, possible or probable AD, definite AD), and plaque density (0, 0.26-7.84, 7.93-42). Mayo subjects were separated into two groups (Control and AD) based on neuropathological evaluation and classification. Control subjects had Braak stage of ≤ 3, CERAD neuritic and cortical plaque densities of 0 (none) or 1 (sparse) and the absence of any of the following pathologic diagnoses: AD, Parkinson’s disease, dementia with Lewy Bodies, vascular dementia, PSP, motor neuron disease, corticobasal degeneration, Pick’s disease, Huntington’s disease, frontotemporal lobar degeneration, hippocampal sclerosis, or dementia lacking distinctive histology. AD subjects have “Definite AD” diagnosis according to the NINCDS-ADRDA criteria and a Braak NFT stage of 4 or greater. For lncRNA and eRNA, we use a linear model to detect differential expression of lncRNA between AD stages, considering sex, age, race, batch, PMI and RIN as covariates, and use stepAIC from MASS R package to select the best model. We required the False Discovery Rate (FDR) < 0.05 and fold change > 1.5. For APA and A-to-I editing, Wilcoxon test were used to test the significance between AD stages with ≥ 10 samples. Significant difference of APA event was defined as absolute value of PDUI difference > 0.1 and FDR < 0.05. Significant difference of editing was defined as absolute value of editing level difference > 0.05 and FDR < 0.05.
Protein coding gene expression correlation
We required ≥ 30 samples in a tissue. We used Spearman's rank correlation to calculate the correlation coefficient (Rs) between non-coding RNA expression/post-transcriptional regulation event and gene expression, and performed multiple correction by FDR. For lncRNA and APA, we calculated the correlation against all the expressed protein-coding genes, defined significant correlation with absolute value of Rs > 0.3 and FDR < 0.05.. For eRNA, we only compared the genes located in upstream/downstream 1Mb of each enhancer, and defined significant correlation with value of Rs > 0.3 and FDR < 0.05.
How to cite