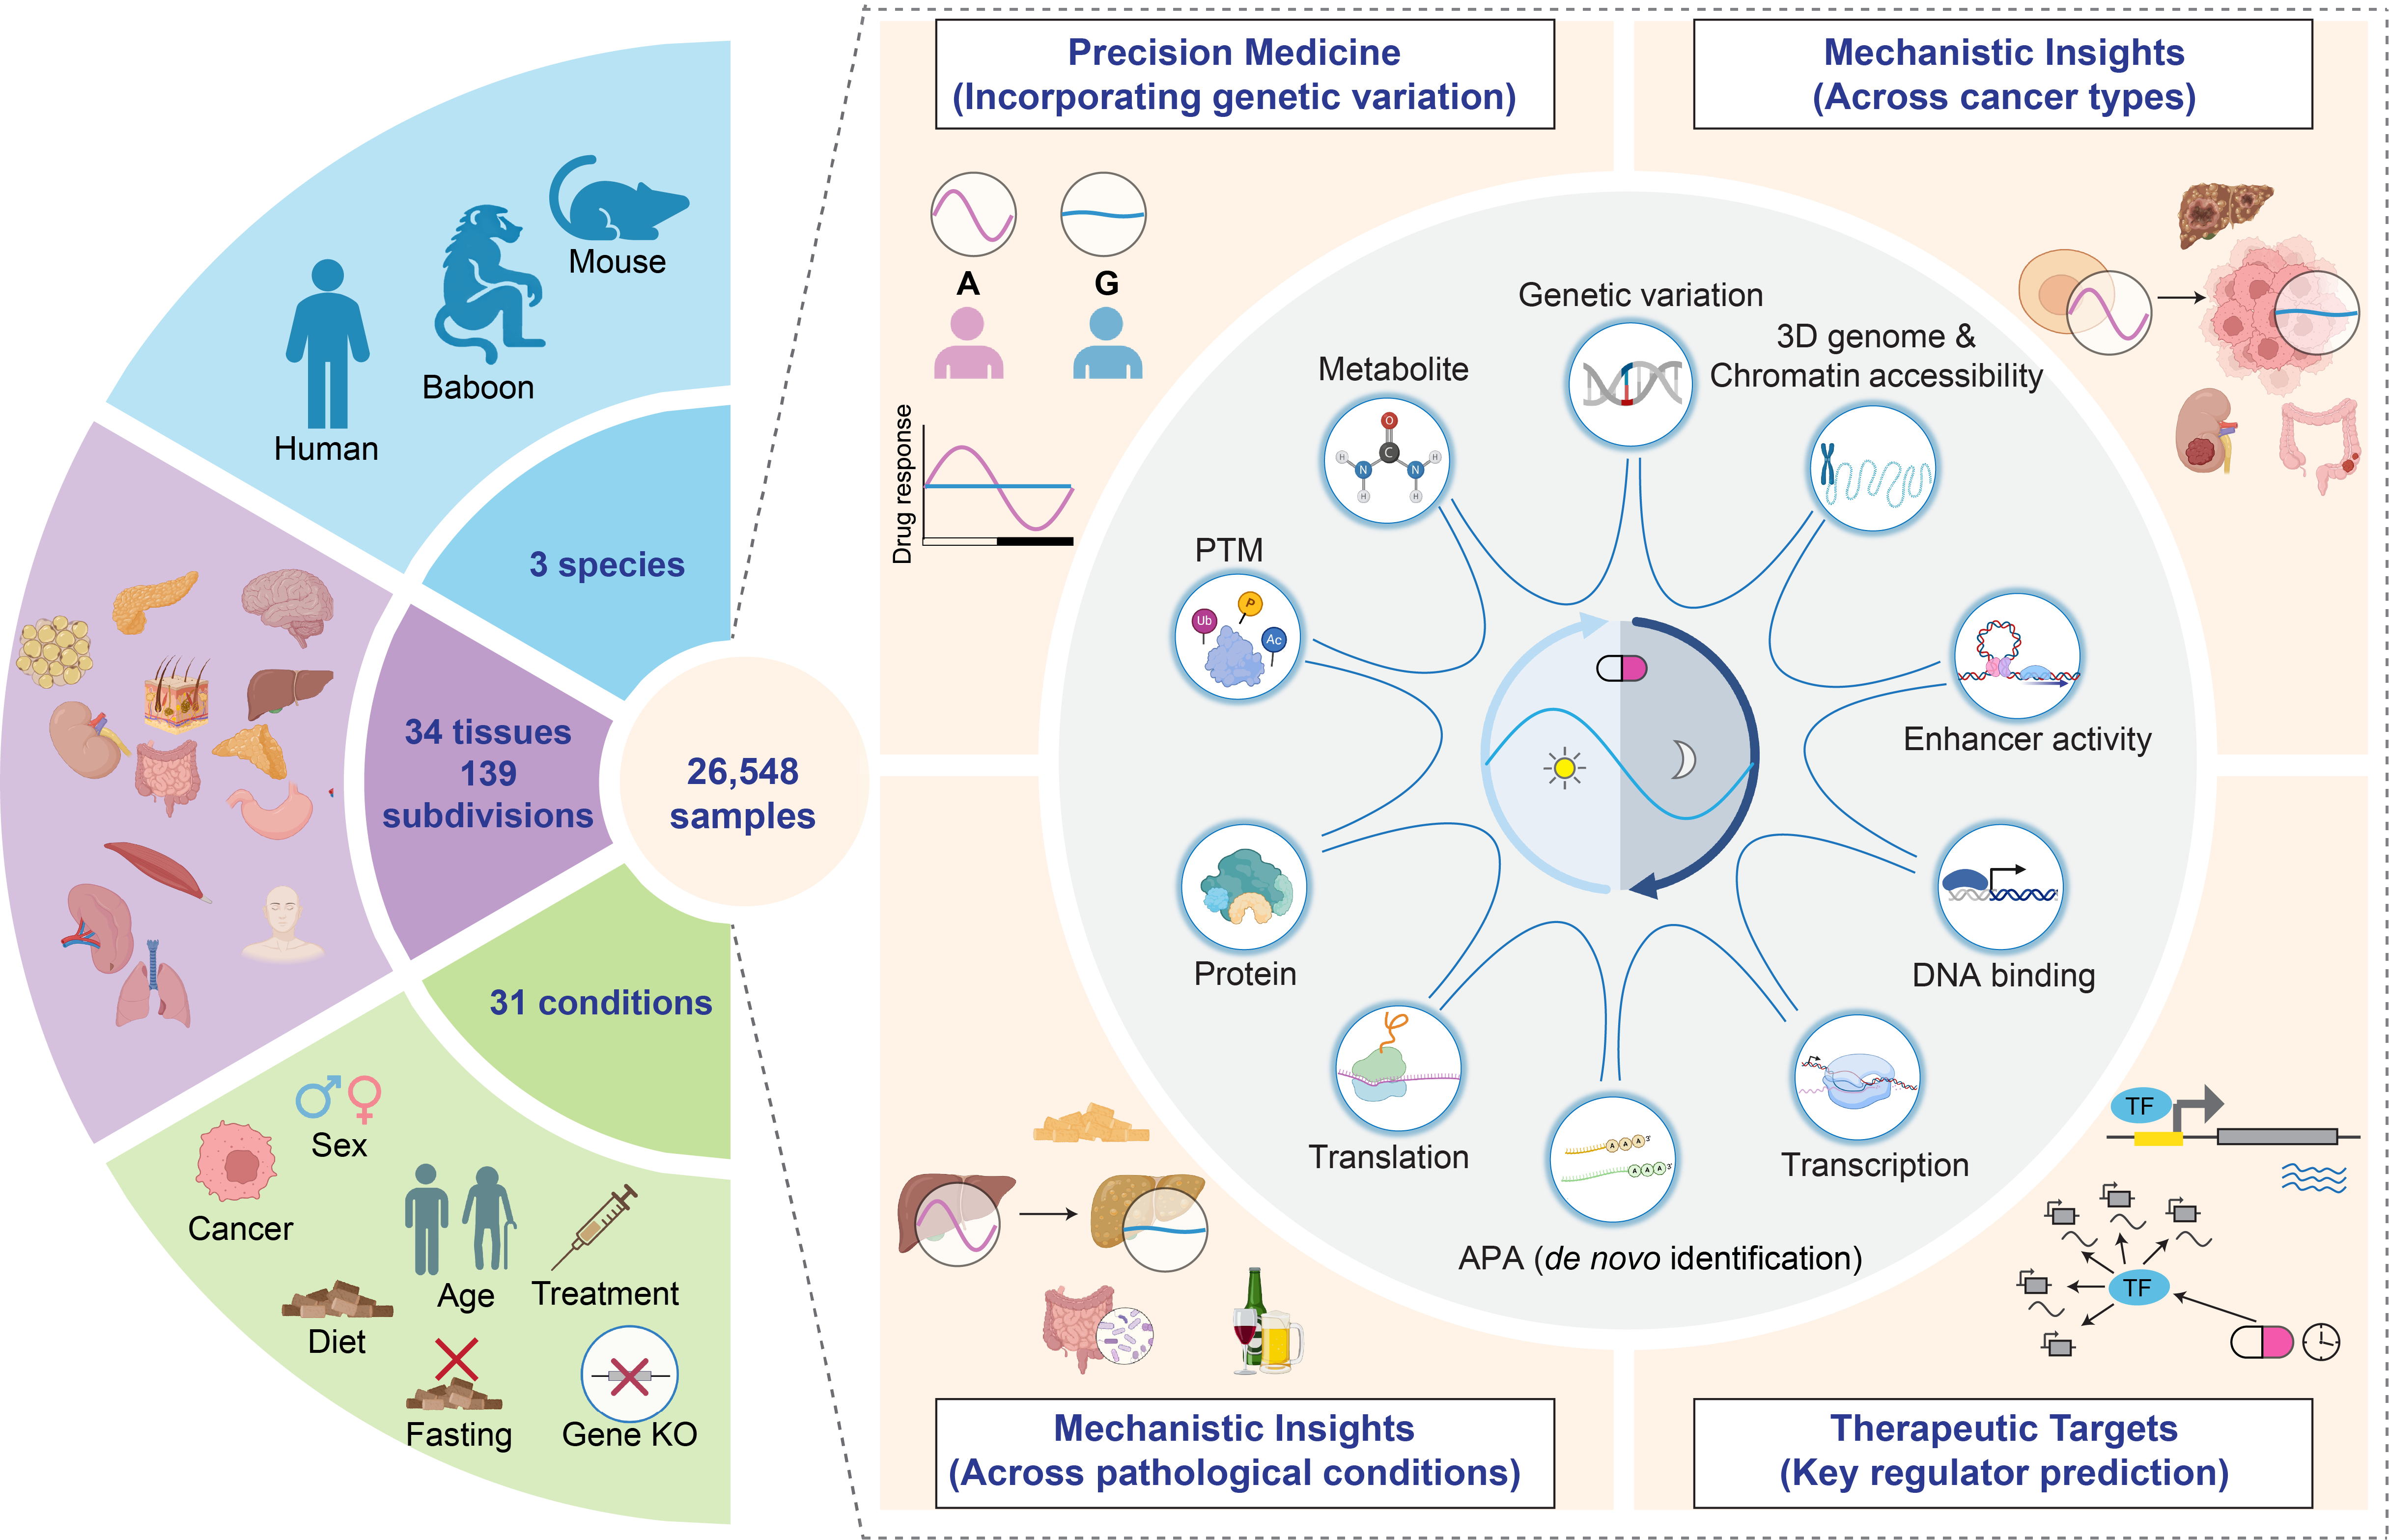
RHINO is a comprehensive multi-omics database that integrates 10 molecular layers, encompassing 26,548 samples across 34 tissues and 139 anatomical subdivisions from humans, baboons, and mice under 31 genetic, pathological, and physiological conditions. We systematically mapped 24-hour rhythms across eight major regulatory levels, including genetic variation, epigenome, transcription, alternative polyadenylation (APA), translation, post-transcriptional modifications (PTMs), proteome, and metabolome. Importantly, we also de novo identified rhythmic APA events, expanding the current understanding of temporal regulation at the post-transcriptional level.
RHINO integrates a wide range of technologies to capture rhythmic regulation across multiple molecular layers:
By integrating these diverse omics layers, RHINO provides mechanistic insights into how genetic and epigenetic factors regulate circadian gene expression and downstream physiological processes. It enables systems-level exploration of the temporal coordination among molecular regulators, proteins, PTMs, and metabolites, offering a powerful resource for studying circadian biology in health and disease.
In RHINO, we provide the following data query and analysis options:
For user-submitted data, gene expression datasets uploaded for rhythmicity analysis are processed transiently and are not stored, shared, or reused beyond the requested analysis. These data are not accessible to the curators or developers of the RHINO platform, nor are they incorporated into future versions of RHINO or used for training or refinement of the AI-assisted chatbot or underlying language models. Data processing is performed in-memory during each session, and no user-uploaded data are retained after analysis completion.
The GRCh38, GRCm38 and Panu_3.0 genome assembly is used for the coordinates of
genetic variants and genes in this database.
** We recommend that you use Chrome, Edge or
Safari for the best user experience. Internet Explorer is not compatible.
To predict and adapt to daily environmental light–dark cycles, nearly all light-sensitive organisms have evolved 24-hour rhythms in gene expression, physiological processes, and behavior. Disruption of these rhythms increases the risk of a wide range of diseases, including cancer, metabolic syndrome, and cardiovascular disorders. Emerging studies, including ours, indicate that administering drugs in alignment with the rhythmicity of their molecular targets can enhance therapeutic efficacy. Likewise, optimizing mealtime has been shown to improve metabolic outcomes in models of diet-induced obesity. These strategies are collectively known as chrono-pharmacology and chrono-nutrition.
Given the fundamental role of circadian rhythms in health and disease, the Nobel Prize was awarded for the discovery of the molecular mechanisms controlling the circadian clock. Recently, many layers of regulation—transcriptional, epigenetic, post-transcriptional, translational, and metabolic—have been intensively explored to understand rhythmic gene expression. However, the genetic basis underlying inter-individual variation in circadian regulation remains largely underexplored.
To address this gap, we developed rhyQTL, a framework to identify rhythmic expression quantitative trait loci (rhyQTLs)—genetic variants that modulate the rhythmicity of gene expression. By systematically mapping rhyQTLs across tissues and conditions, we reveal novel mechanisms through which genetic variation can influence internal biological timing.
We integrated rhyQTL analysis into RHINO, an interactive multi-omics platform for exploring the biological functions of 24-hour rhythmicity in health and disease. RHINO enables users to visualize circadian patterns, regulatory layers, and genetic influences across species and tissues, offering a comprehensive resource for chrono-medicine.
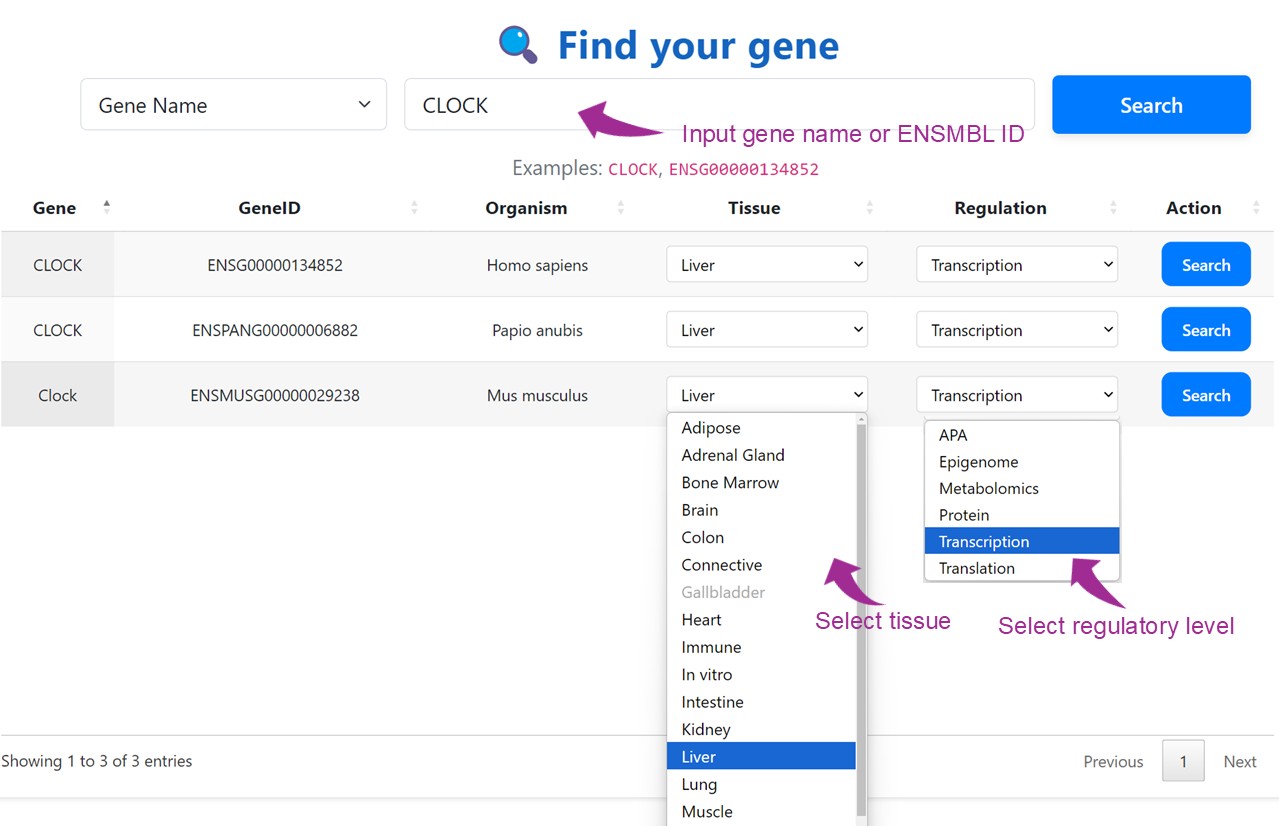
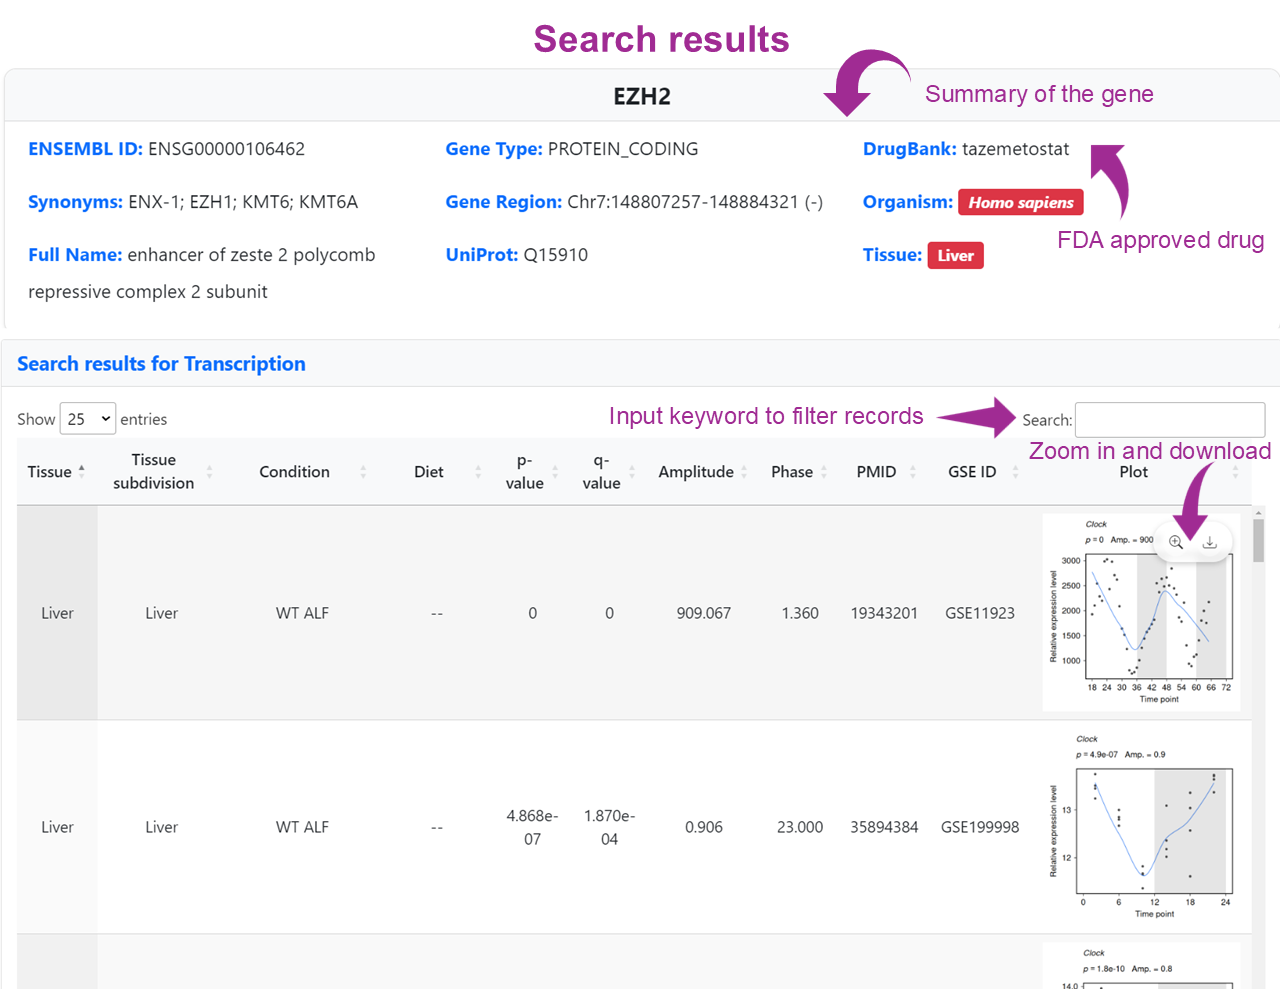
This search module enables users to explore gene-specific rhythmic regulation across multiple organisms, tissues, and molecular regulatory layers. Users can input either a gene symbol or Ensembl Gene ID to initiate the query. For each matched gene, the interface supports selection of tissue type and regulatory level (e.g., transcription, translation, epigenome, protein, etc.) to narrow down the search. By clicking the "Search" button, users can retrieve and visualize the relevant results for their tissue- and context-specific research needs.
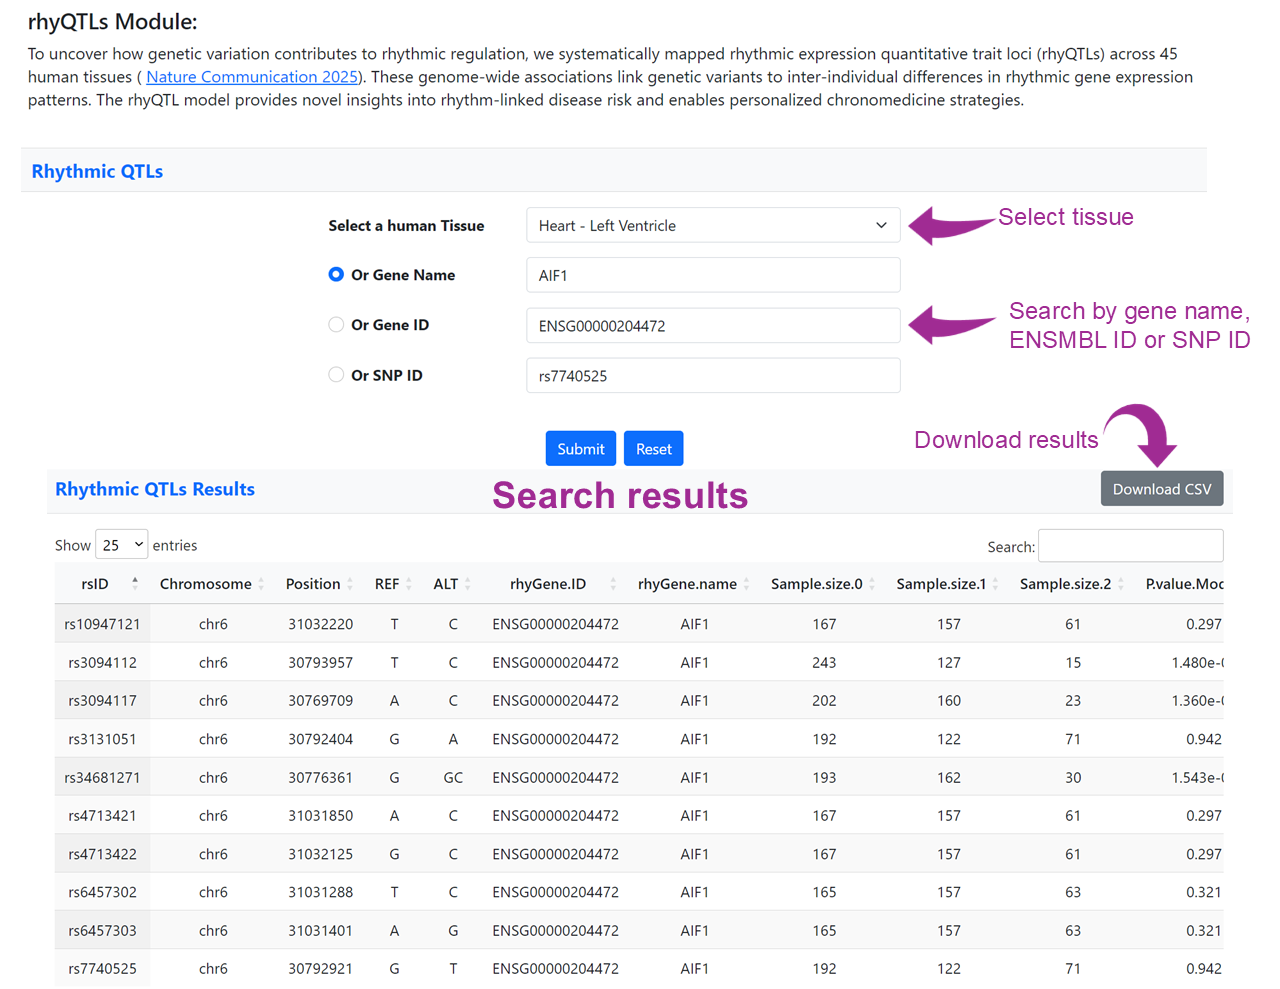
This module allows users to explore how genetic variants influence rhythmic gene expression in human tissues. By selecting a tissue and entering a gene name, Ensembl gene ID, or SNP ID, users can identify rhyQTLs that associate genetic variation with changes in circadian amplitude or phase. This provides valuable insights into rhythm-linked disease susceptibility and supports the development of personalized chronomedicine strategies.
The search results are presented in a tabular format, where each row represents a rhythmic QTL (rhyQTL) identified in the selected tissue. Key columns include:
These results help users interpret how specific genetic variants may shift the phase, amplitude, or significance of rhythmic gene expression across genotypes.
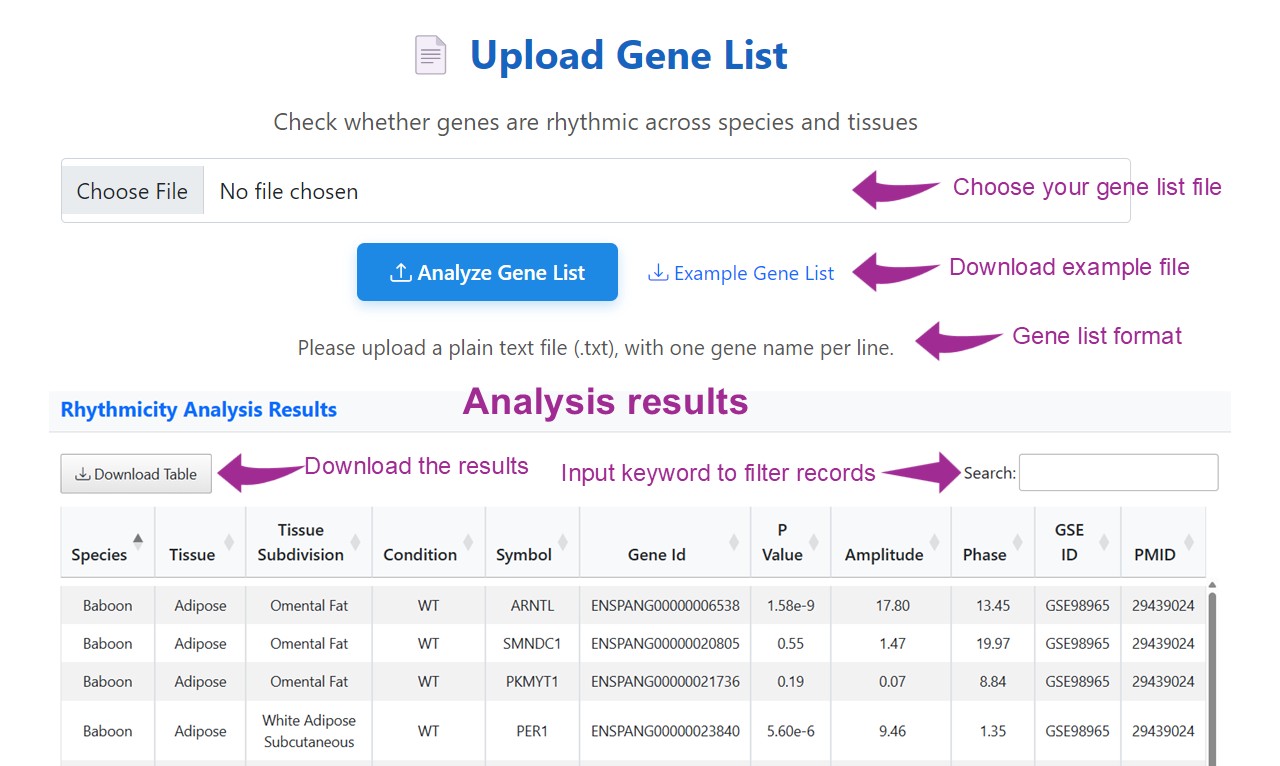
Upload a plain text file containing a list of gene names (one per line) to perform high-throughput analysis of rhythmic expression across species, tissues, and experimental conditions. This tool enables rapid identification of genes showing 24-hour rhythmicity, helping researchers uncover temporal regulation patterns at a systems level.
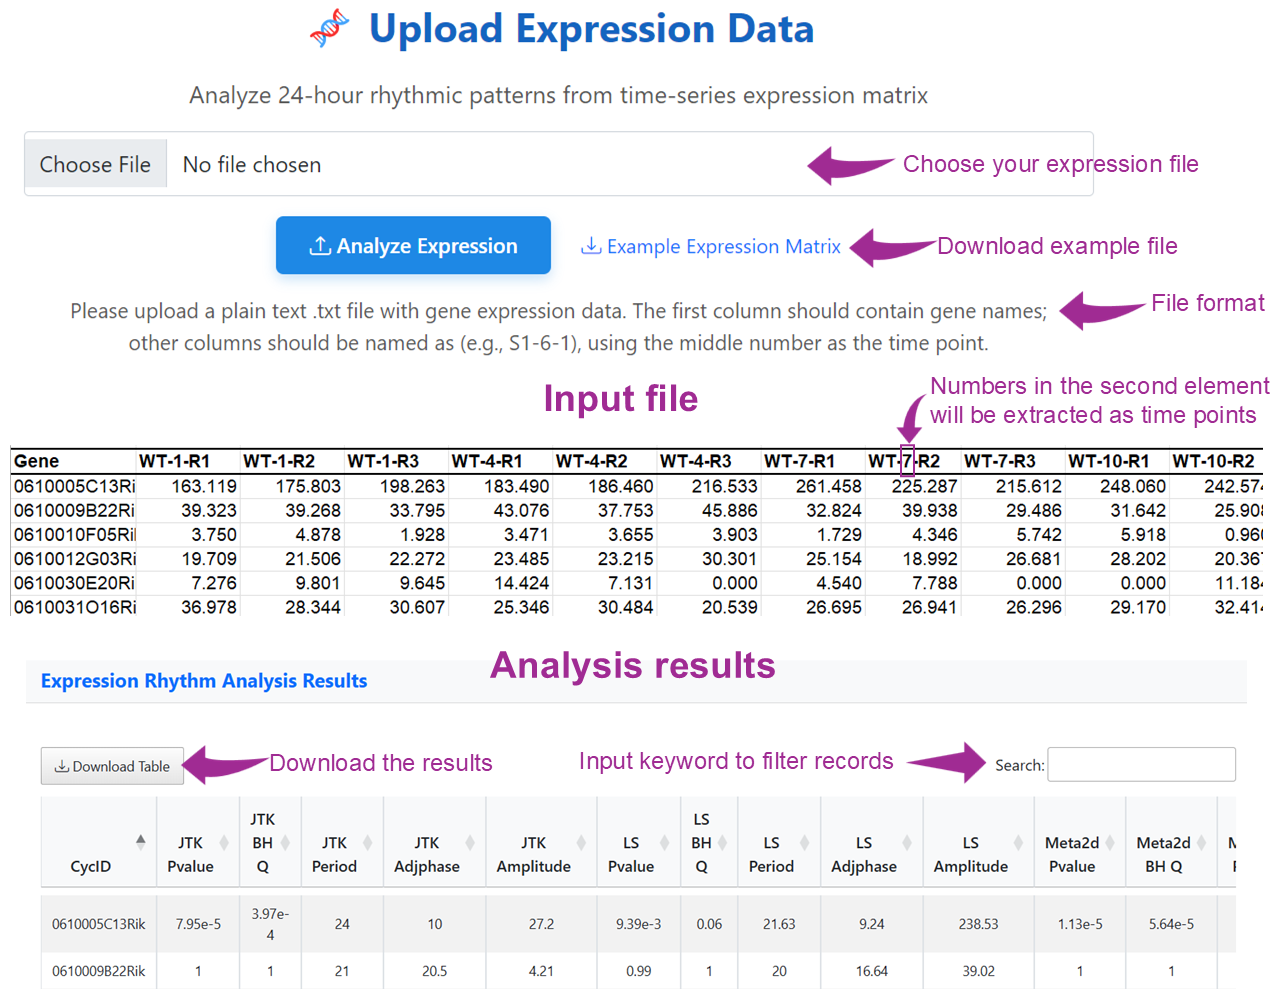
Upload your own time-series gene expression matrix to perform de novo detection of 24-hour rhythmicity. The first column should contain gene names, and time points will be automatically extracted from sample names. This tool enables personalized analysis of circadian patterns in your dataset.
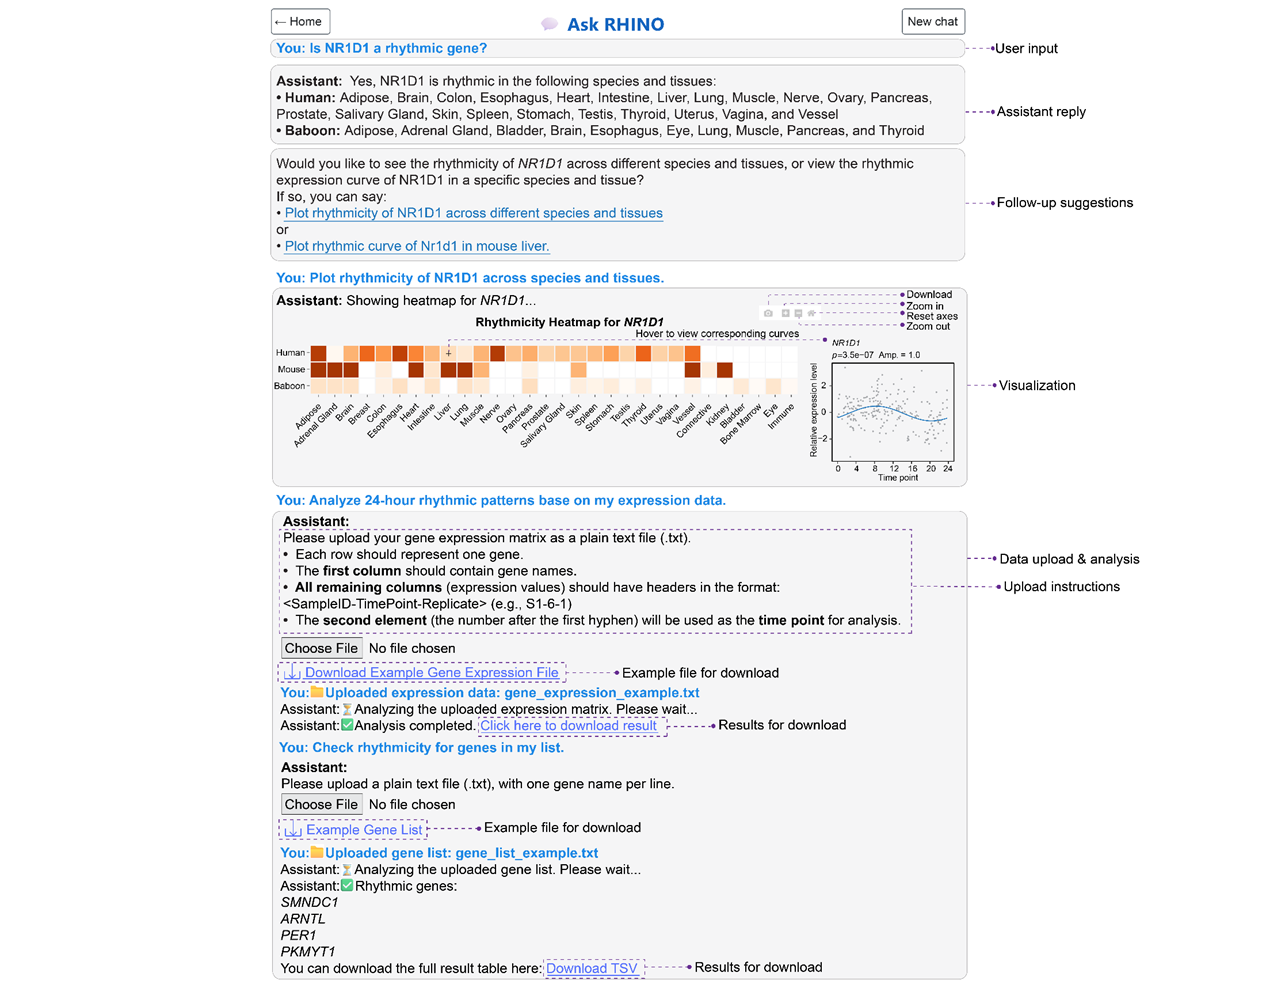
Chat with our AI-powered assistant to explore gene rhythmicity, retrieve cross-species expression profiles, or perform personalized analysis. The assistant supports natural language queries and guides you through gene search, data interpretation, and custom rhythmic analysis in real time.