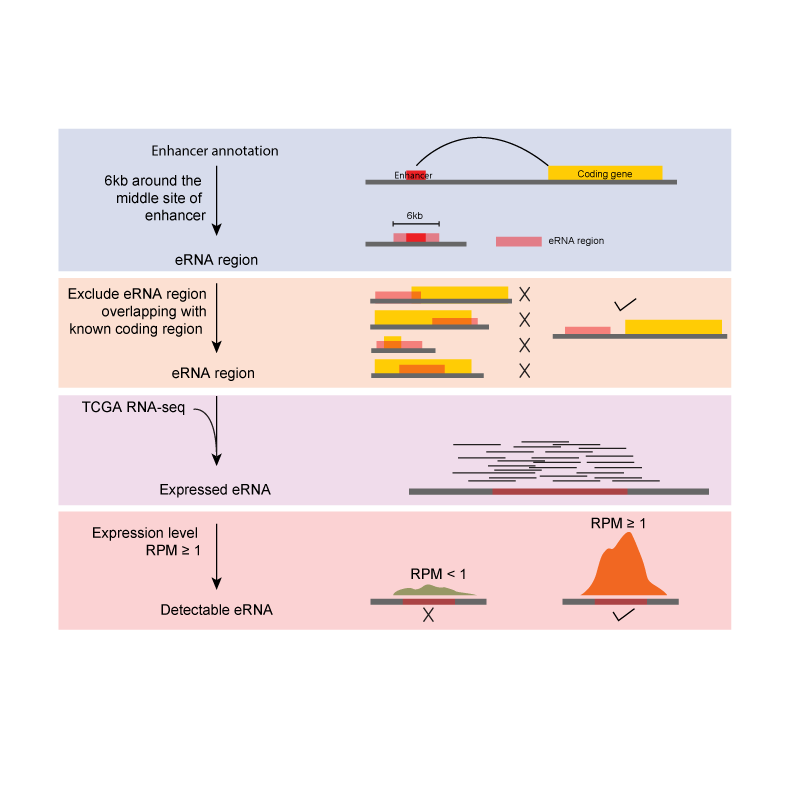
Quantification of eRNA expression
Annotation of enhancers based on ENCODE was collected from Ensembl 87. Annotation of protein-coding genes was collected from GENECODE and UCSC Genome Browser (hg38). We extended the ± 3kb around the enhancer middle site as eRNA region, and filtered out eRNA regions overlapping with known coding regions. We then mapped RNA-seq data to these eRNA regions, and calculated the expression level as reads per million (RPM). We defined the detectable eRNA with RPM ≥ 1. We converted different genome versions of human genome by liftover.
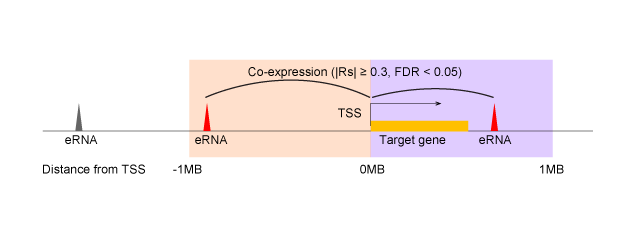
eRNA target genes, drugs, and cancer signaling pathways
Lorem ipsum dolor sit amet, consectetur adipiscing elit. Pellentesque eleifend... Lorem ipsum dolor sit amet, consectetur adipiscing elit. Pellentesque eleifend... Lorem ipsum dolor sit amet, consectetur adipiscing elit. Pellentesque eleifend... Lorem ipsum dolor sit amet, consectetur adipiscing elit. Pellentesque eleifend...
Clinically relevant eRNAs
We used the Student’s t-test to assess the statistical difference between tumor and paired normal samples and defined significantly aberrant expression as abs(fold change) bigger than 1.5 and FDR less than 0.05. We used ANOVA test to access the statistical difference across different categories in subtype, stage, grade and smoking history (FDR < 0.05). Only groups with ≥ 5 samples were included in these analyses. We used the univariate Cox model or Logrank test to test whether eRNA expression is associated with patient overall survival times.