
PancanQTLv2.0 is the updated database of PancanQTL
to provide a comprehensive resource of genetic, pharmacogenomic, and immune landscape of genes for human cancer in TCGA.
In PancanQTLv2.0, we provide following data queries:
1) Browse or search fine-mapping credible sets of eQTLs across human cancers.
2) Browse or search Pan-cancer eQTLs that overlap with GWAS linkage disequilibrium (LD) regions.
3) Browse or search drug-related eQTLs that have significant genetic effect on drug response across human cancers.
4) Browse or search immune-related eQTLs that have significant genetic effect on immune cell abundance across human cancers.
The GRCh37 genome assembly is used for the coordinates of genetic variants and genes in this database.
** We recommend that you use Chrome, Edge or Safari for the best user experience. Internet Explorer are not compatible.
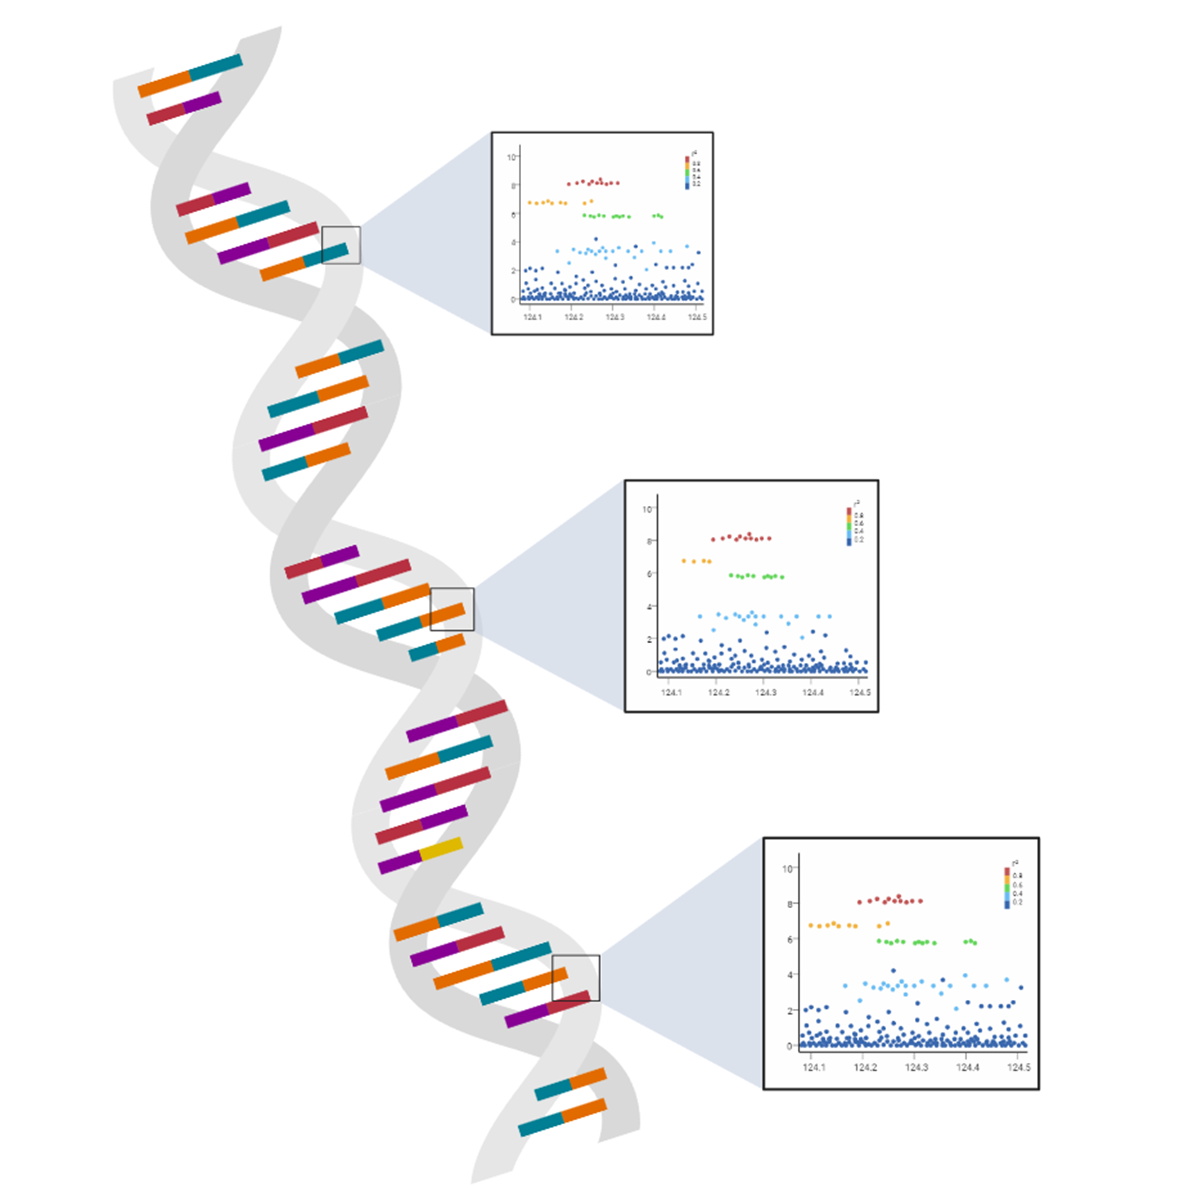
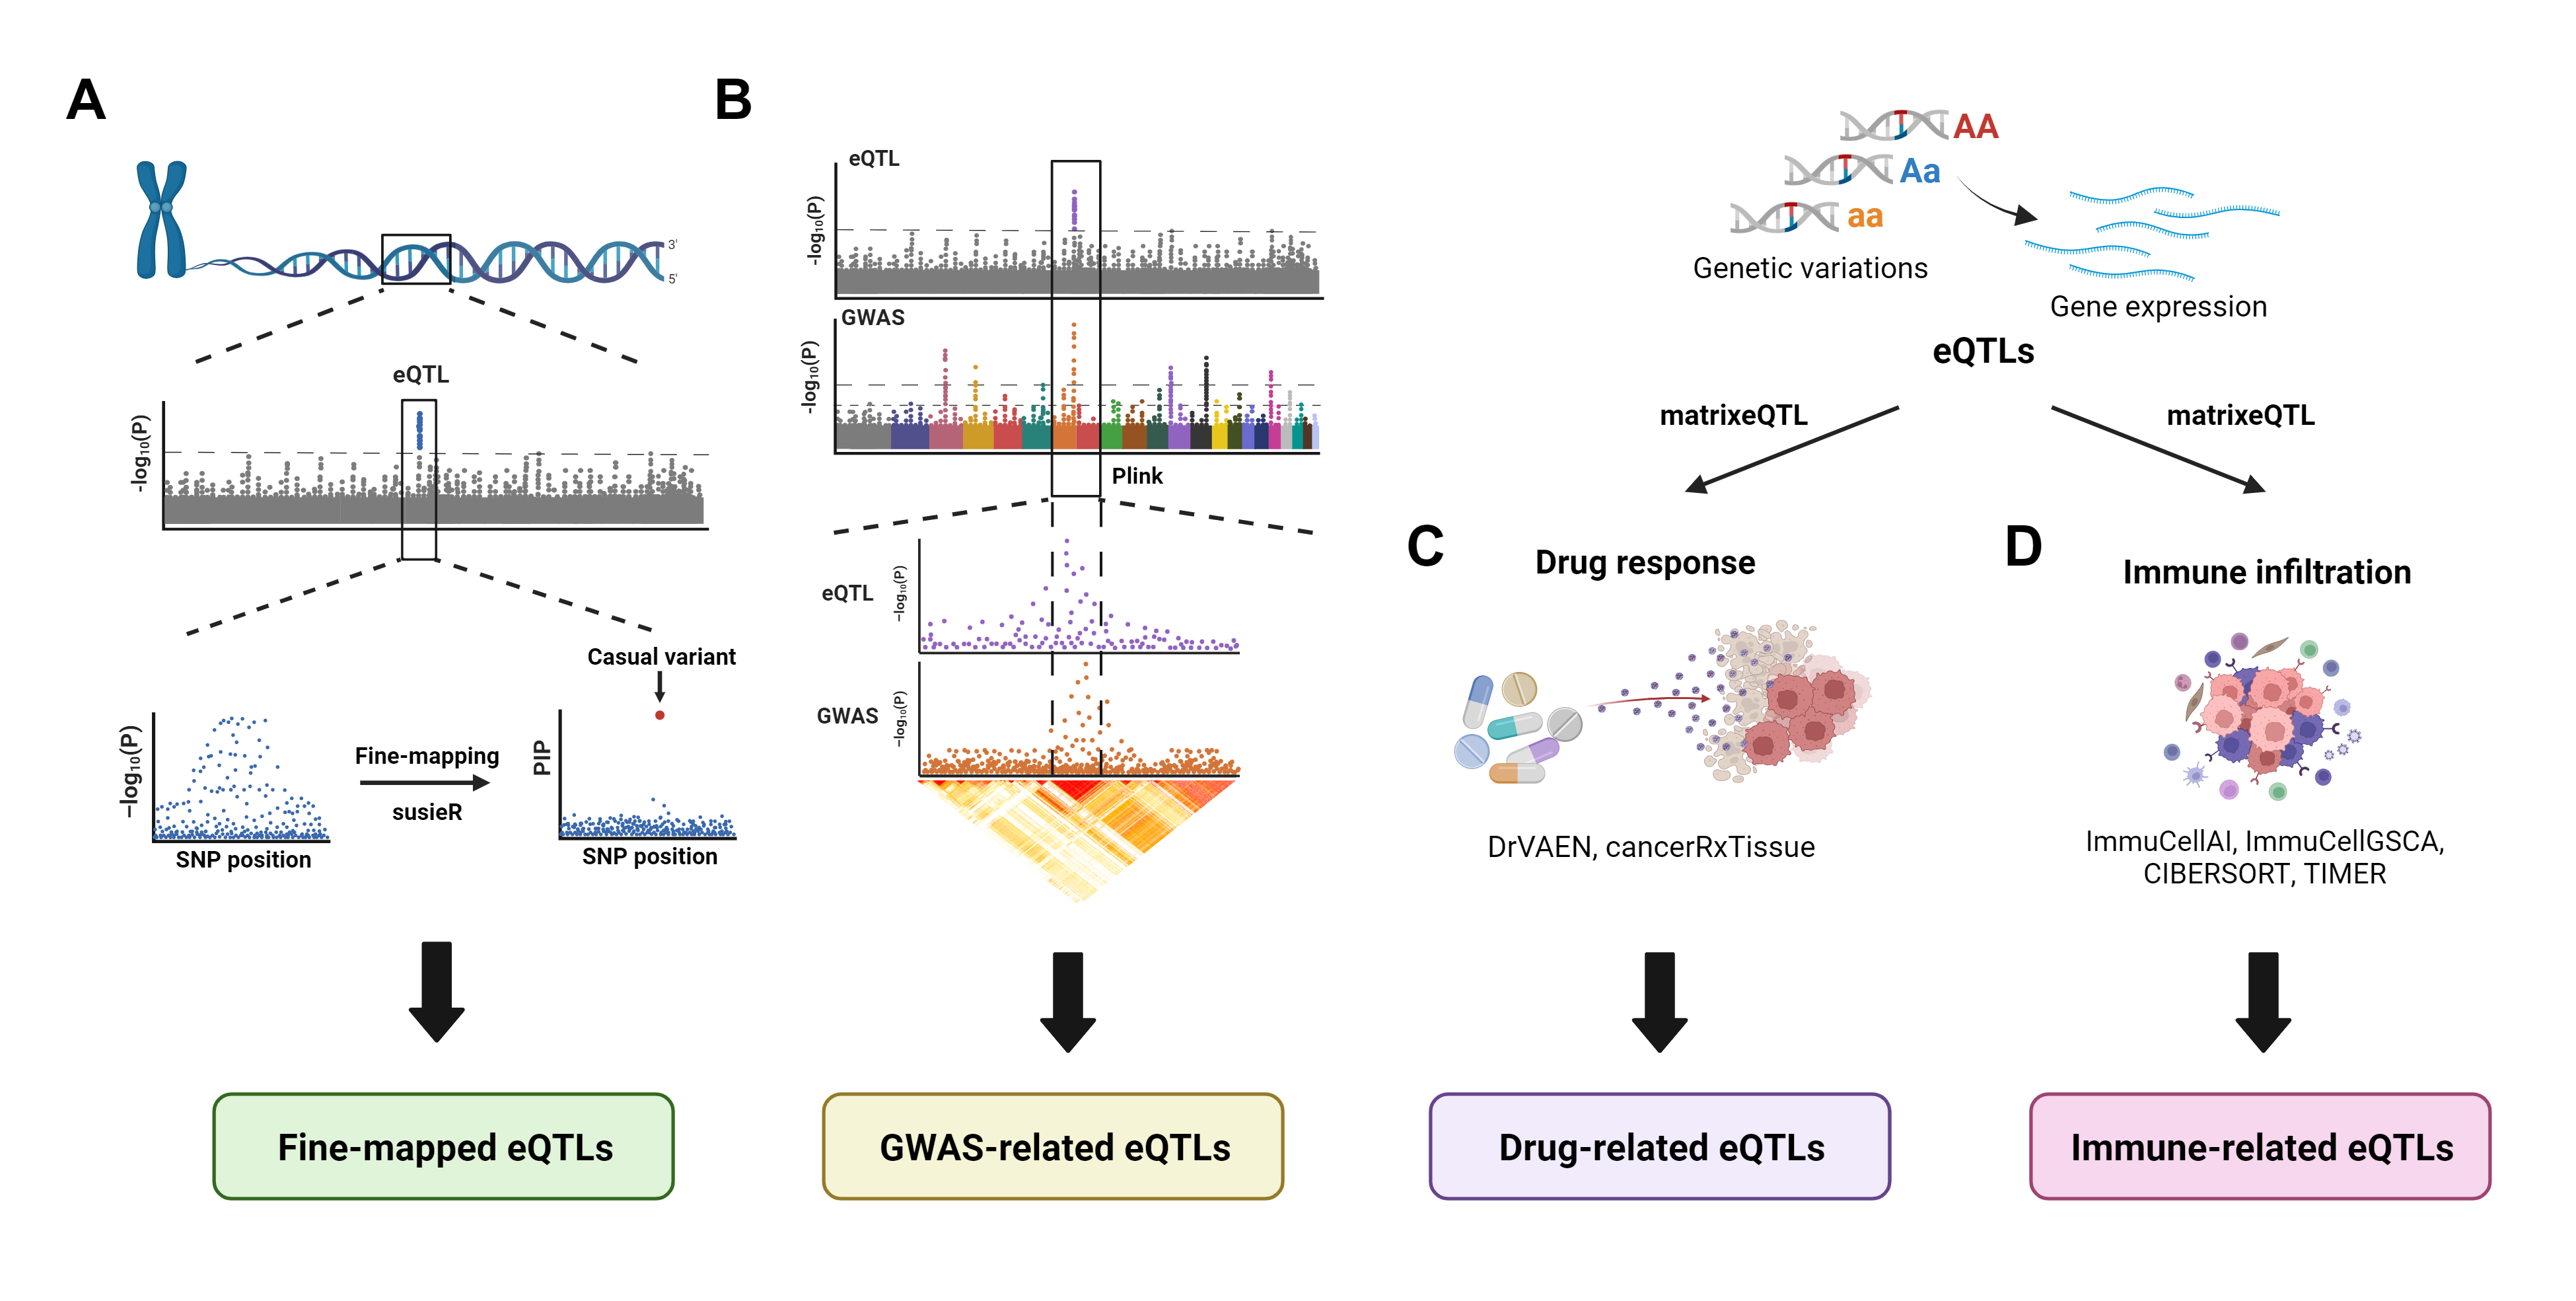
eQTL Fine-mapping module:
This module collected the 90% credible sets of potential causal variants for eQTLs in each gene across 25 types of human cancers.
Statistical fine-mapping was performed using the Sum of Single Effects Model (SuSiE) implemented in the susieR R package.
We selected 25 cancer types with a sample size greater than 100 for the analysis.
In each cancer type, genes that had at least one cis-eQTL with an FDR < 0.05 were selected for fine-mapping analysis.
All SNPs within the cis-region were included to calculate the posterior inclusion probabilities (PIPs) to determine their likelihood of being causal.
The final 90% credible sets, a set of variants prioritized by PIP score with summed PIP ≥ 0.90, were reported.
GWAS eQTL module:
This module collected eQTLs that overlap with GWAS linkage disequilibrium (LD) regions (r² ≥ 0.5).
The GWAS risk variants were obtained from the GWAS catalog
(accessed on 06/22/2023), encompassing 529,713 top genetic associations from 6,422 publications.
We employed the Plink
software to calculate the r² values between eQTLs and GWAS loci.
The LD reference panel was based on the European super-population from phase 3 of the 1000 Genomes Project.
eQTLs exhibiting an r² ≥ 0.5 with GWAS loci were included in our database.
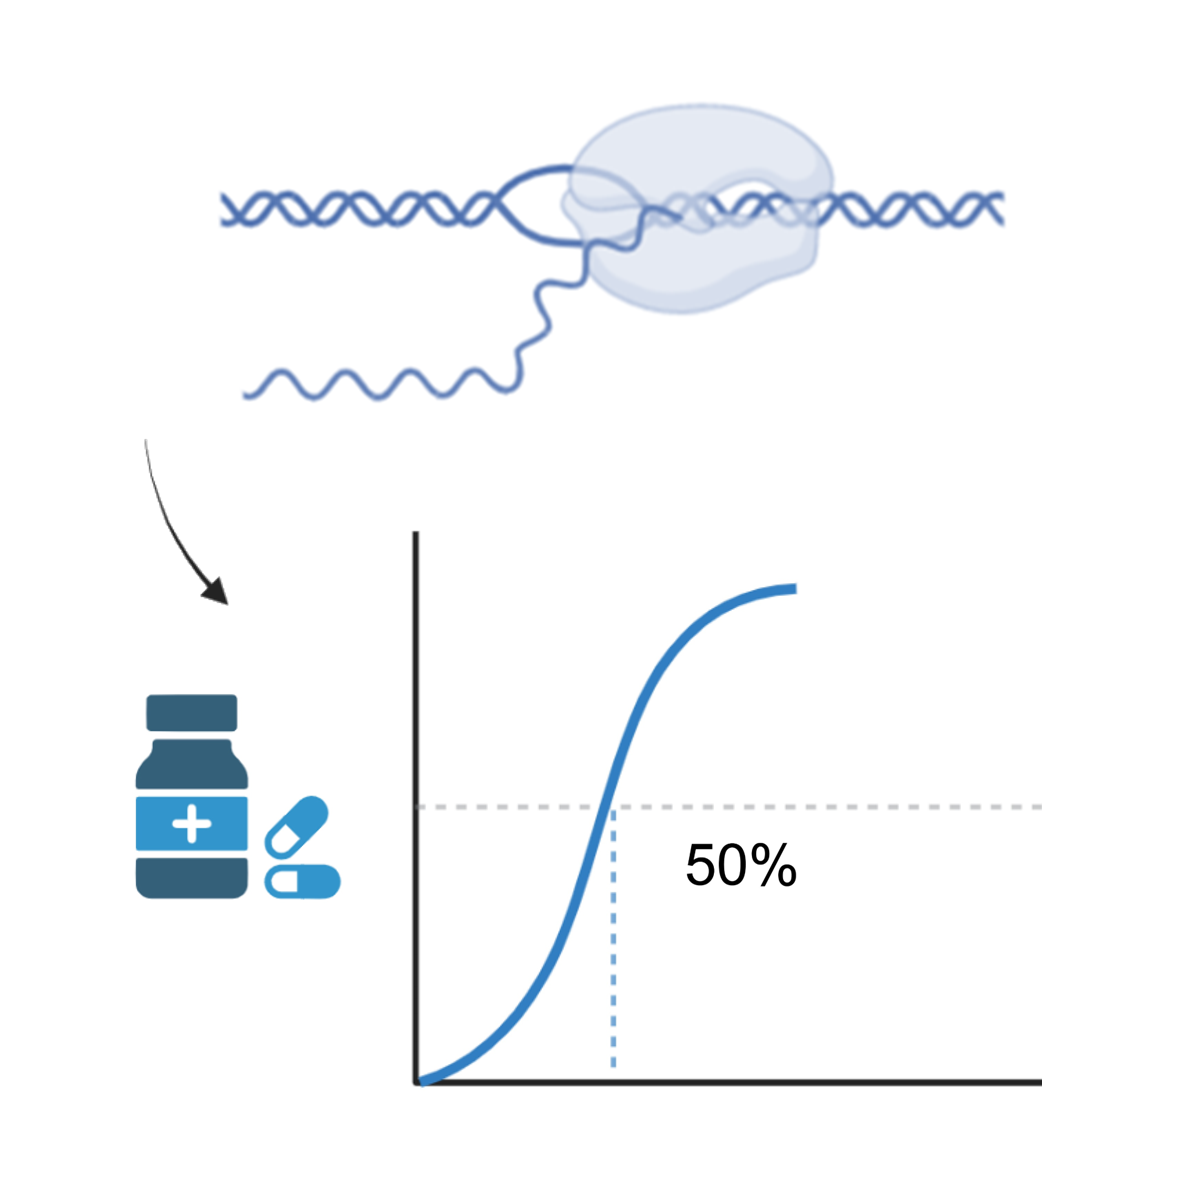
Drug response module:
This module collected eQTLs that exert a significant genetic effect on imputed drug response (FDR < 0.05) across various human cancers.
For each cancer type, the genetic impact of eQTLs on drug response was assessed through linear regression using MatrixEQTL.
The imputed drug response datasets were sourced from the DrVAEN and cancerRxTissue databases.
To mitigate potential influences from clinical status and population structure, patient age, sex, tumor stage, and the top 5 principal components were included as confounding factors.
FDR control was applied to each drug within each cancer type, and eQTLs with FDR < 0.05 were categorized as drug-related eQTLs.
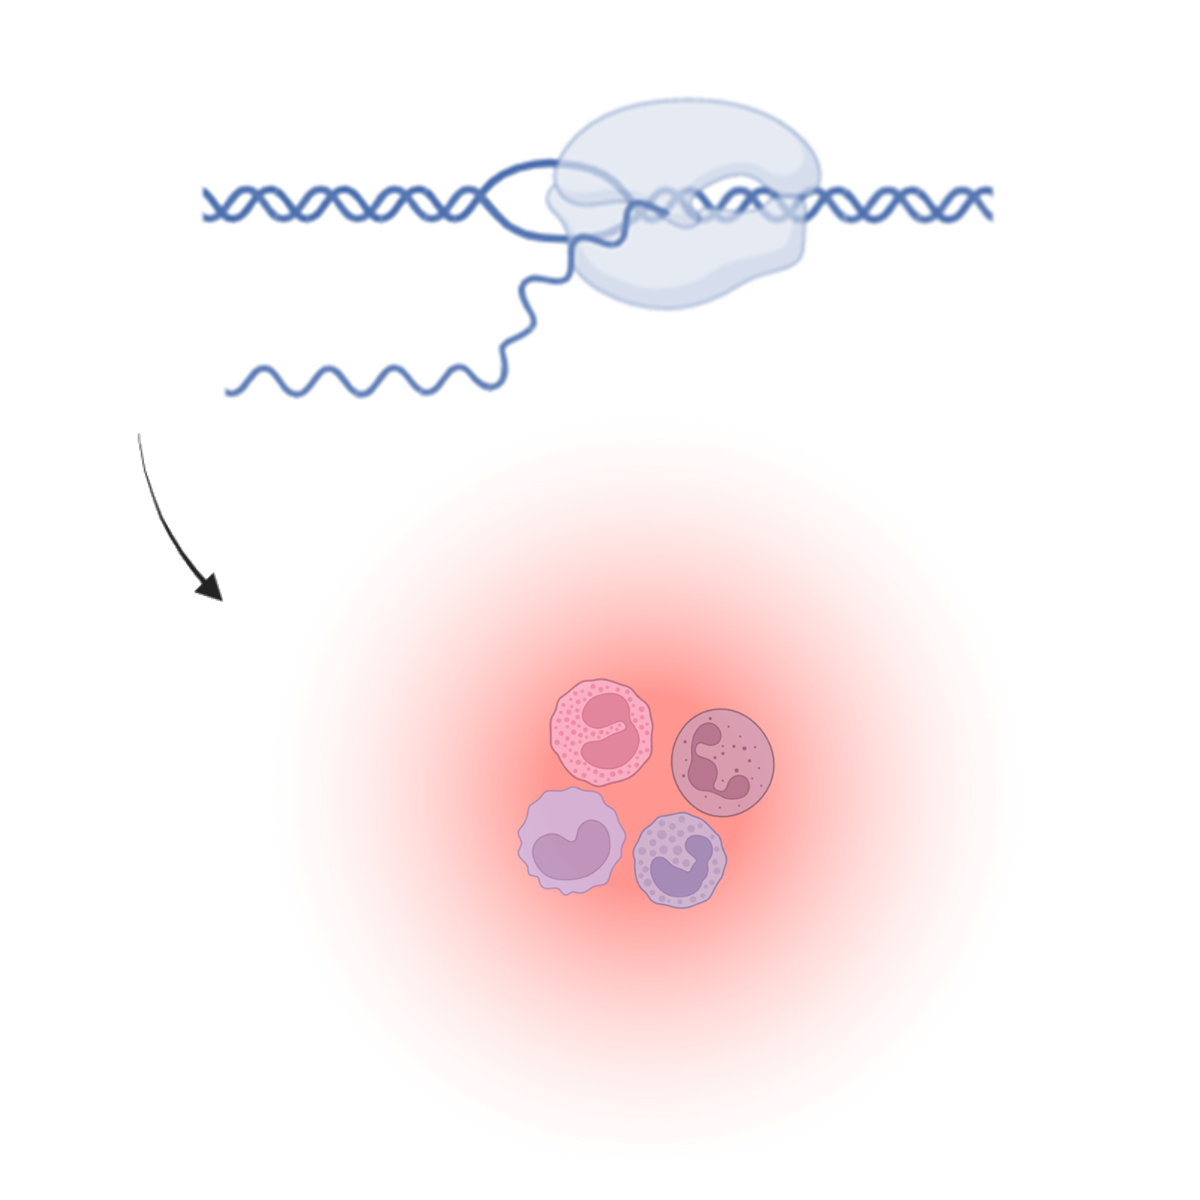
Immune infiltration module: This module collected eQTLs that exert a significant genetic effect on immune cell abundance (FDR < 0.05) across various human cancers. For each cancer type, the genetic impact of eQTLs on immune cell abundance was assessed through linear regression using MatrixEQTL. The imputed immune cell abundance datasets were sourced from the TIMER, CIBERSORT, ImmuneCellAI, and ImmuneCellGSVA databases. To mitigate potential influences from clinical status and population structure, patient age, sex, tumor stage, and the top 5 principal components were included as confounding factors. FDR control was applied to each immune cell within each cancer type, and eQTLs with FDR < 0.05 were categorized as immune-related eQTLs.
| Cancer Type | Number of Samples | Fine-mapping credible sets | GWAS-related eQTLs | Drug-related eQTLs (DrVAEN) | Drug-related eQTLs (cancerRxTissue) | Immune-related eQTLs (ImmuneCellsGSVA) | Immune-related eQTLs (ImmuCellAI) | Immune-related eQTLs (TIMER) | Immune-related eQTLs (CIBERSORT) |
|---|
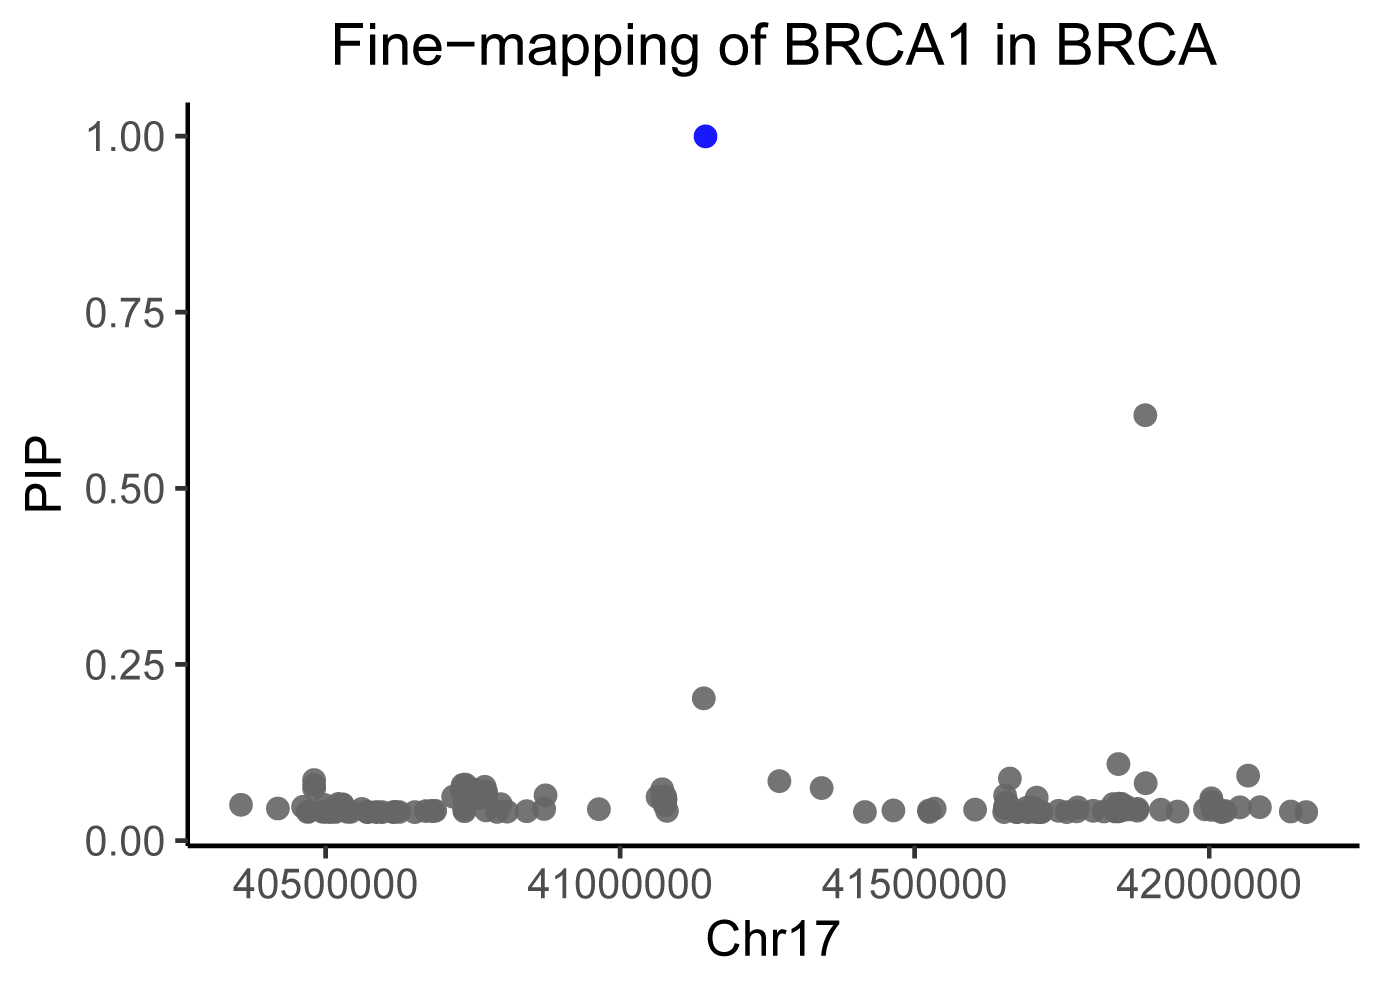
The Fine-mapping locus plots in eQTL Fine-mapping module display the posterior inclusion probabilities (PIP) values of SNPs in the cis-region of the target gene. The X-axis represents genomic positions, the Y-axis depicts PIP values, and the points with colors highlight credible sets.
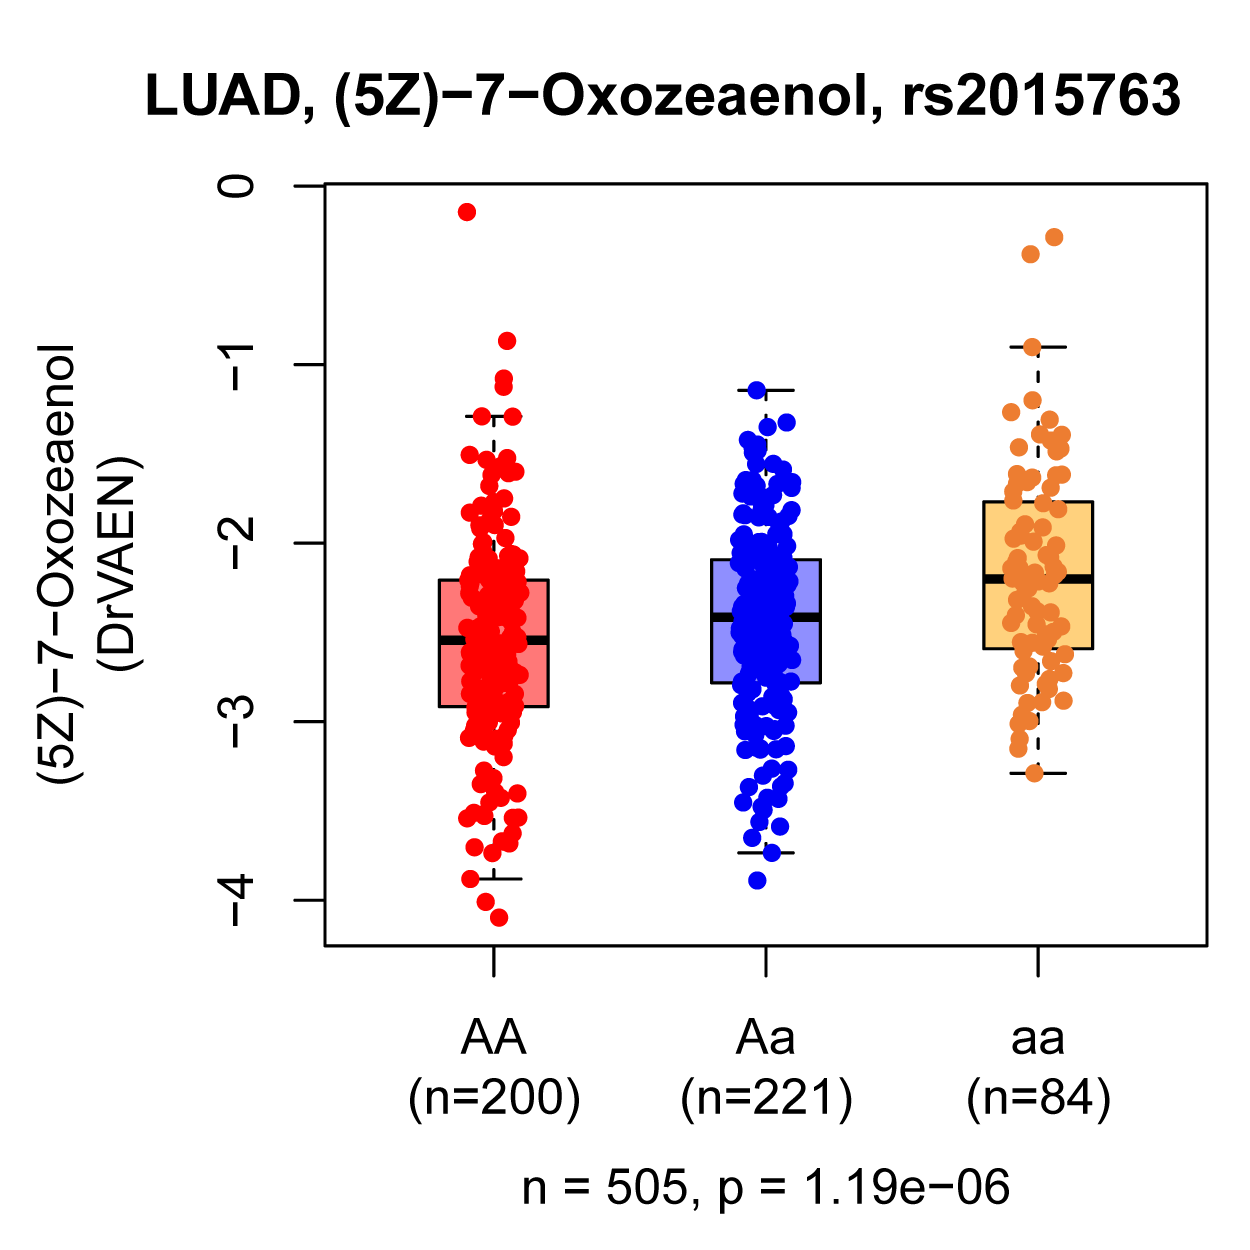
QTL boxplots in Drug response module and Immune infiltration module represent the imputed drug response or immune cell abundance in individuals carrying homozygote AA, heterozygous Aa, and homozygote aa, respectively.